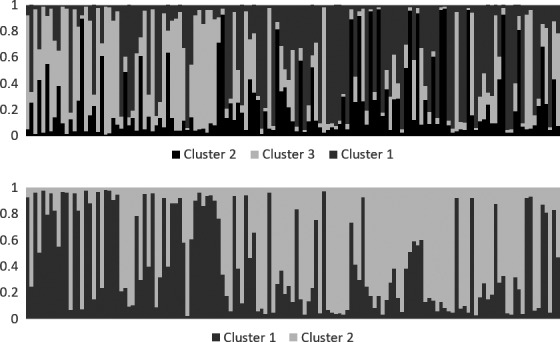
Figure 3.

Results from the Bayesian cluster assignment analysis with STRUCTURE of 132 female lynx from southern Finland from 2007 to 2015. Upper panel: model with three clusters; lower panel: model with two clusters. Samples are grouped according to their harvest location and sorted by longitude from west (left) to east (right). The y‐axis indicates the membership coefficient q, that is the likelihood of belonging to a particular cluster. Each bar represents one individual and the length of each section of one bar corresponds to the q value for the respective cluster
