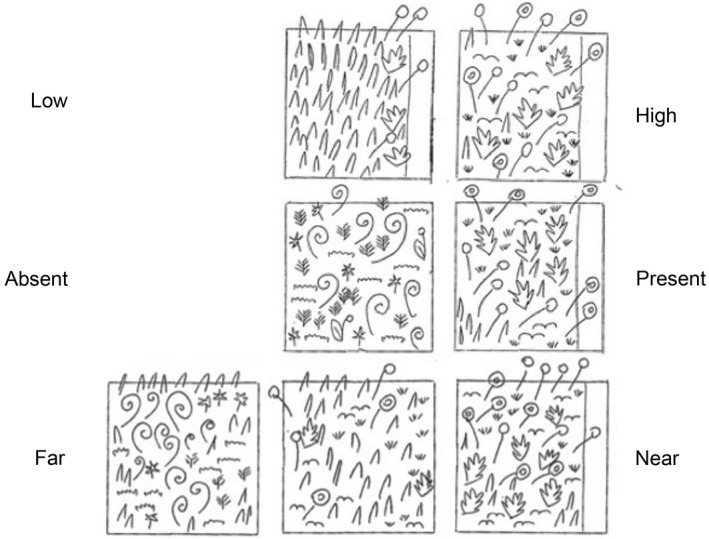
Figure 6.

An illustration of possible community differences captured by various experimental comparisons, with each square representing a typical quadrat. In each case, the community that results from the path is the same, but the comparisons affect how this effect is measured. Top row, both the “High” and “Low” quadrats are next to paths, one which is used with high intensity, one with low intensity. High–Low may capture different levels of conversion from an original community (dominated by the pointy blade species, left) to a more species‐rich one (right). This comparison may yield large effect sizes. Middle row, the “Present” quadrat is next to a path, and the “Absent” one is not near a path. Present–absent may capture two entirely different communities, with the result that the effect size observed may be large, small, or null. In this example, the two communities are different but of similar richness: on the left there are five species, and on the right there are six species, with no overlapping species. Bottom row, the “Near” quadrat is next to a path and the “Far” quadrats are increasingly farther from the same path. Near–Far, here shown with two interpretations of “Far” (middle and far left columns), may either capture a community more like the “Absent” community (far left column), or more like the “Low” community (middle column), depending on how “Far” is interpreted, and how far the edge effect of the path extends. Across studies, this type of comparison may yield a mix of large and small effect sizes
