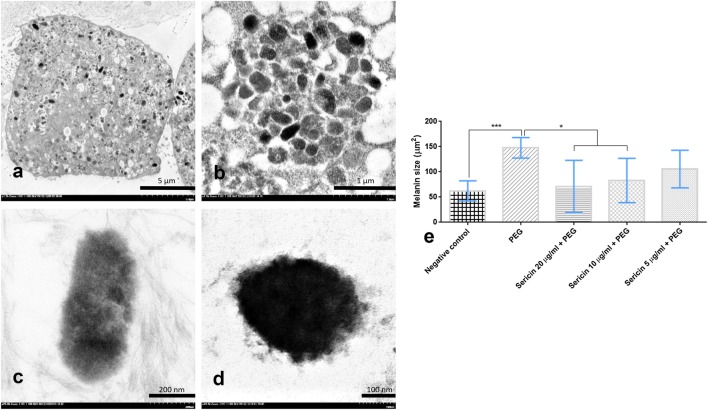
Fig. 6.
Melanin pigment size among sericin-treated groups compared with negative control and non-treated groups; Melanocyte laden melanin pigment (a) showed a number of melanin depositions in its cytoplasm with difference stages (b): immature (c) or mature (d) melanin pigments. Size comparison of melanin pigments is shown in the bar graph (e)

