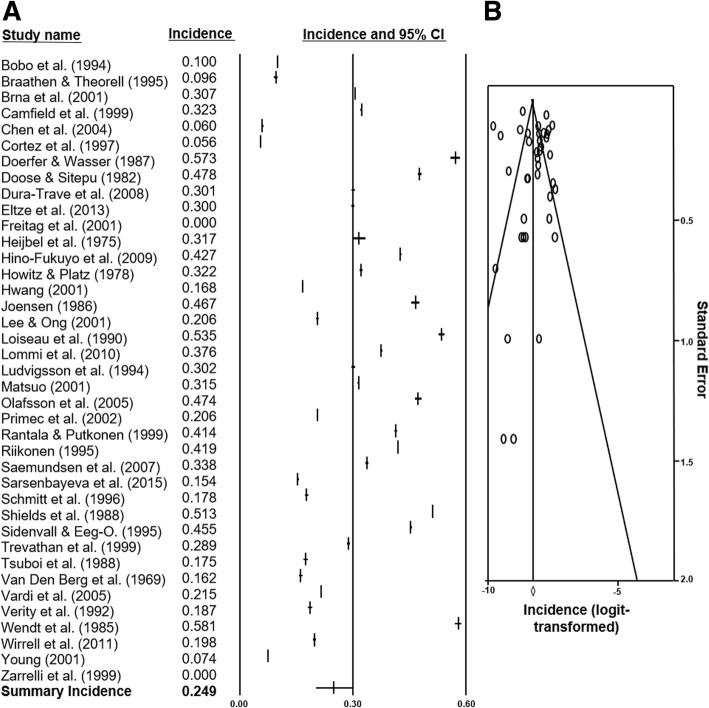
Fig. 4.
Forest plot and funnel plot of incidence studies included in analysis. a 39 studies [15–53] and their incidence statistics are listed individually. The summary rate, calculated with meta-analysis and random-effects modelling, is listed on the final row. b 39 logit-transformed incidence figures are plotted against their individual standard errors

