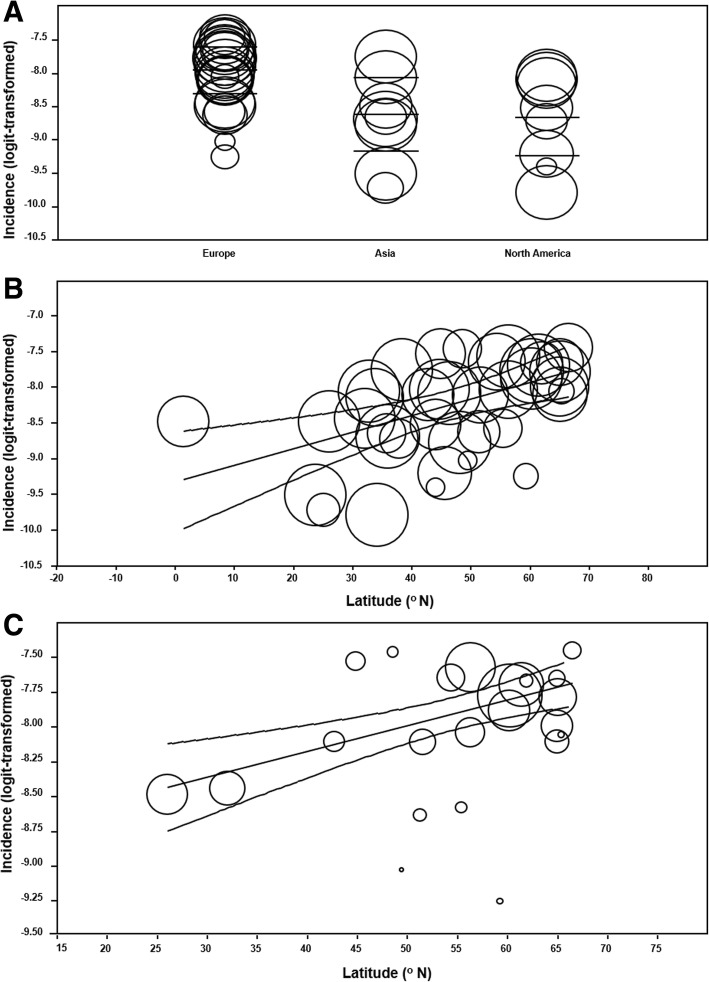
Fig. 6.
Scatter plots of incidence and geographical covariates. Incidence of infantile spasms abstracted from 39 studies [15–53] are represented as circles proportional to sample size and arranged in scatter plots according to continent and latitude. a Global incidence is categorized by continent with mean and 95% confidence intervals (CIs) also shown, consisting of 22 European studies, 9 Asian studies, and 8 North American reports. No South American, African, or Oceanic reports were identified. b Global incidence of IS is plotted against latitude. The lines indicate line of regression and associated 95% CIs. c Incidence within Europe only plotted against latitude. 95% CIs and line of regression are also shown

