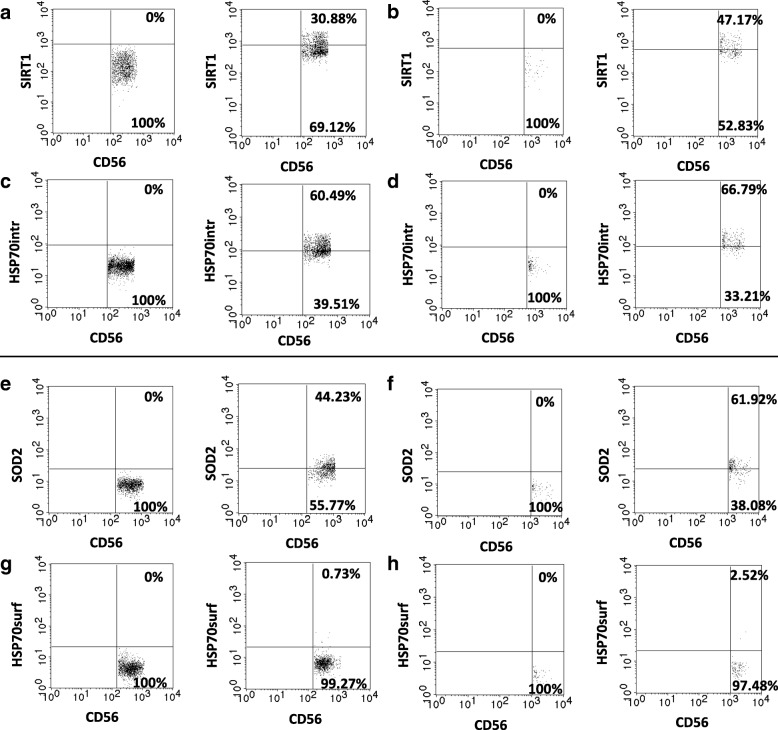
Fig. 2.
Flow cytometry analysis performed on NK cell subsets. Upper panel: CD3/CD56/SIRT1/HSP70intracellular staining (a-d). Lower panel: CD3/CD56/SOD2/HSP70surface staining (e-h). a SIRT1 staining in CD56dim cells: left - isotype control; right - sample, CD56dim cells expressing SIRT1 were identified in the upper right quadrant. b SIRT1 staining in CD56bright cells: left - isotype control; right - sample, CD56bright cells expressing SIRT1 were identified in the upper right quadrant. c HSP70intracellular (HSP70intr) staining in CD56dim cells: left - isotype control, right - sample; CD56dim cells expressing intracellular HSP70 were identified in the upper right quadrant. d HSP70intracellular (HSP70intr) staining in CD56bright cells: left – isotype control; right sample; CD56bright cells expressing intracellular HSP70 were identified in the upper right quadrant. e SOD2 staining in CD56dim cells: left - isotype control, right - sample; CD56dim cells expressing SOD2 were identified in the upper right quadrant. f SOD2 staining in CD56bright cells: left - isotype control; right - sample; CD56bright cells expressing SOD2 were identified in the upper right quadrant. g HSP70surface (HSP70surf) staining in CD56dim cells: left - isotype control, right - sample; CD56dim cells expressing surface HSP70 were identified in the upper right quadrant. h HSP70surface (HSP70surf) staining in CD56bright cells: left - isotype control, right - sample; CD56bright cells expressing surface HSP70 were identified in the upper right quadrant

