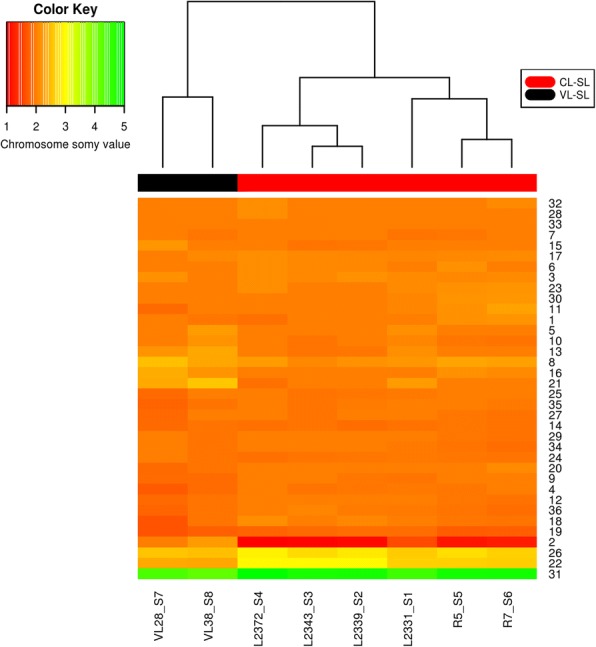
Fig. 2.

Heat map showing the comparison of aneuploidy profiles of CL-SL and VL-SL isolates. Chromosome numbers are listed along the right side y-axis and L. donovani CL and VL isolates are listed along the bottom x-axis. The dendrogram on top of heat map indicates the clustering pattern of the 8 isolates based on their aneuploidy similarity. The colour bar below the dendrogram represents the phenotype of isolate (Red-CL-SL and Black-VL-SL). The colour key represents the ploidy level of chromosomes in the heat map: chromosome somy > 4 green, trisomy – yellow, disomy – orange and monosomy – red
