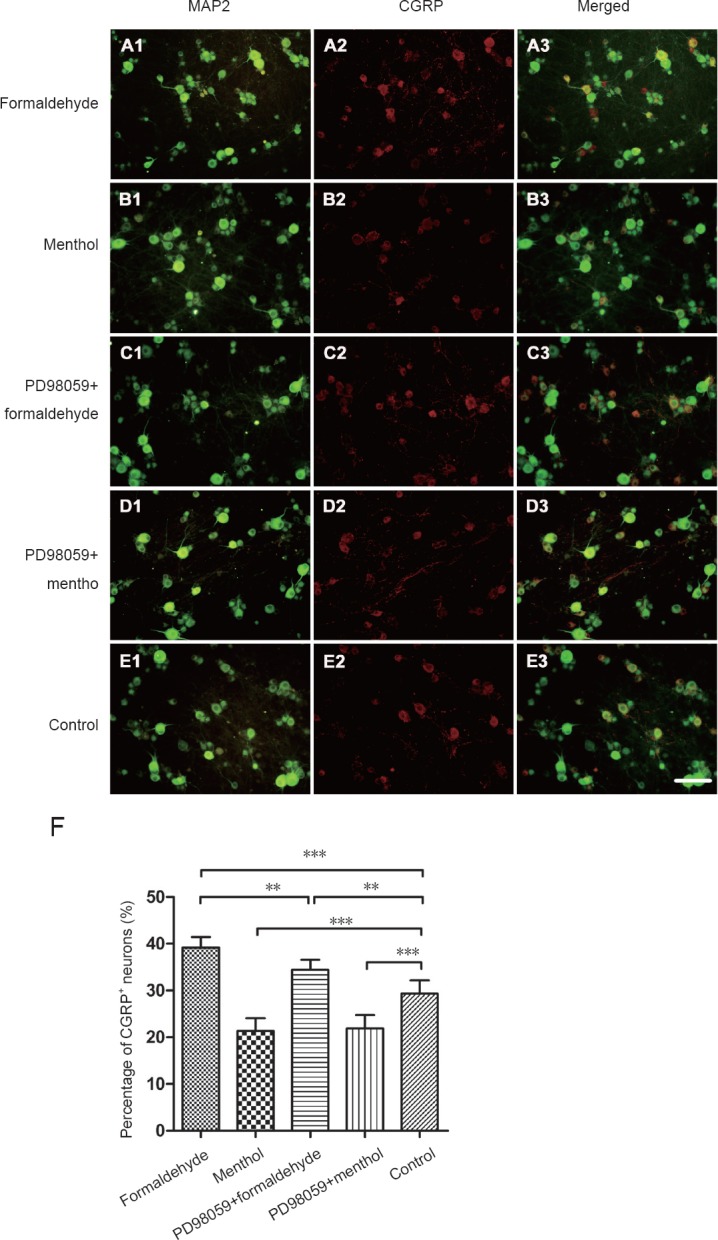
Figure 4.

Double immunofluorescence for calcitonin gene-related peptide (CGRP) and microtubule-associated protein 2 (MAP2) in dorsal root ganglion (DRG) neurons.
CGRP was visualized with the Cy3-conjugated secondary antibody (red). MAP2 was visualized with the Cy2-conjugated secondary antibody (green). (A) Formaldehyde: DRG neurons were exposed to formaldehyde 10 μM. (B) Menthol: DRG neurons were exposed to menthol 300 μM. (C) PD98059 + formaldehyde: PD98059 (10 μM) was added 30 minutes before formaldehyde (10 μM) exposure. (D) PD98059 + menthol: PD98059 (10 μM) was added 30 minutes prior to menthol (300 μM) exposure. (E) Control group. The bar in the figure represents 100 µm. (F) Histogram (mean ± SD) for quantification of CGRP-positive neurons. Formaldehyde elevated the proportion of CGRP-positive neurons. Menthol reduced the proportion of CGRP-positive neurons. The increase in CGRP-positive neurons induced by formaldehyde was inhibited by PD98059. The proportion of CGRP-positive neurons is expressed as the mean ± SD (n = 5, one-way analysis of variance followed by Student-Newman-Keuls post hoc test). **P < 0.01, ***P < 0.001.
