Figure 3.
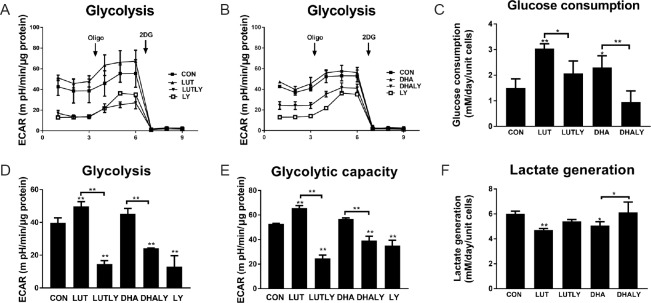
Lutein or DHA treatment affects cellular glycolysis.
(A) Lutein increased glycolytic function and it was reversed by PI3K inhibitor LY294002 co-treatment. (B) DHA increased glycolytic and was reversed by LY294002 co-treatment. (C) Glucose consumption increased by treatment of lutein or DHA. LY294002 co-treatment with lutein or DHA reversed this increasing (F(4,15) = 15.7, P < 0.01). (D) Quantification of basal glycolysis by subtracting non-glycolytic ECAR (after adding 2DG) from ECAR before adding oligomycin (F(5,11) = 49.5, P < 0.01). (E) Quantification of maximum glycolytic capacity by subtracting non-glycolytic ECAR (after adding 2DG) from ECAR after adding oligomycin (F(5,11) = 9.8, P < 0.01). (F) Generation of lactate reduced by treatment of DHA or lutein. LY294002 co-treatment with DHA or lutein reversed this reduction (F(4,15) = 8.4, P < 0.01). Statistical significance: *P < 0.05 and **P < 0.01, vs. CON (one-way analysis of variance followed by the least significant difference post hoc test), data are expressed as the mean ± SEM, three replications in each group. ECAR: Extracellular acidification rate; Oligo: oligomycin (2 μM); 2DG: 2-Deoxy-D-glucose (50 mM); CON: control; LUT: lutein (5 μM); LUTLY: lutein (5 μM) + LY294002 (10 μM); DHA: docosahexaenoic acid (10 μM); DHALY: DHA (10 μM) + LY294002 (10 μM); LY: LY294002 (10 μM).

