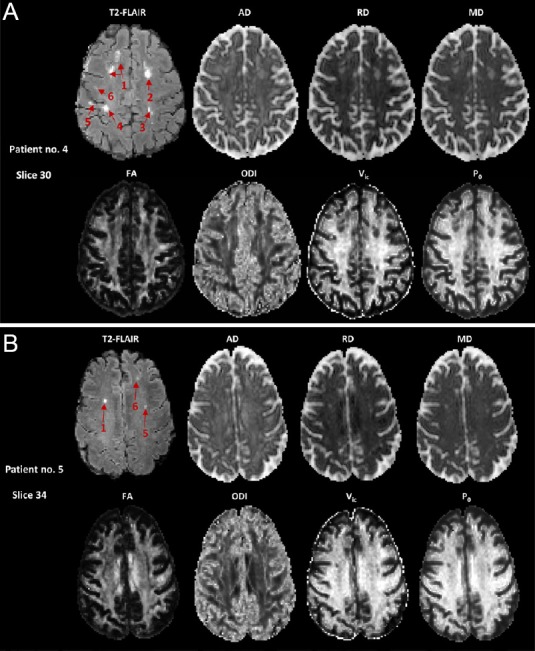
Figure 3.

Co-registered MRI maps of two patients with multiple sclerosis (MS).
(A) Patient No. 4. Six hyperintense lesions in the T2-FLAIR image can be appreciated. Note that the two separated hyperintense regions of lesion 1 were connected in another slice (not shown). The lesion segmentation results in the same patient are shown in Figure 2. The corresponding areas in the diffusion maps appeared hyperintense in the AD, RD, and MD maps, and hypointense in the FA, Vic, and P0 maps. The gray scale is 0–300 AU for T2-FLAIR; 0–3 × 10⁻³ mm2/s for AD, RD, and MD; and 0–1 for FA, ODI, Vic, and P0. (B) Patient No. 5. Three hyperintense lesions in the T2-FLAIR image can be appreciated. AD: Axial diffusivity; AU: arbitrary unit; FA: fractional anisotropy; FLAIR: fluid attenuated inversion recovery; MD: mean diffusivity; ODI: orientation dispersion index; P0: q-space derived zero-displacement probability; RD: radial diffusivity; Vic: volume fraction for intra-axonal water.
