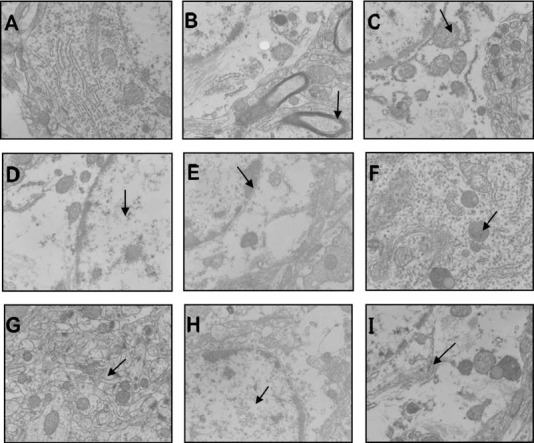
Figure 3.

Ultrastructural changes of nerve cells in brain tissue from each group by transmission electron microscopy (uranium acetate and lead nitrate dyeing staining).
(A) Sham-operation group; (B–E) 3-, 9-, 24-, and 48-hour model groups; (F–I): 3-, 9-, 24-, and 48-hour acupuncture groups. Arrows point to severe edema (B), abnormal morphology in peripheral glial cells (C, D), cristae membrane fusion (E), relatively even chromatin distribution in nuclei (F, G), and moderate edema (H, I). Original magnification, 15,000×.
