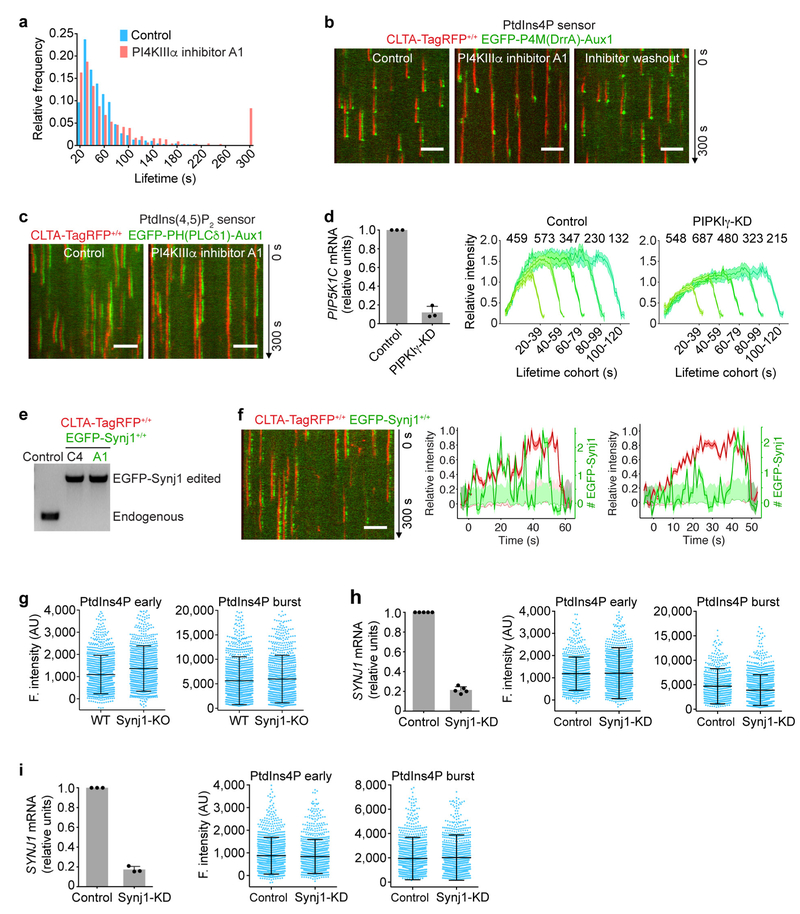
Extended Data Figure 6 |. Effects of interfering with the activity of inositol kinases and inositol phosphatases on the PtdIns4P and PtdIns(4,5)P2 content of endocytic clathrin-coated structures.
a, Inhibition of PI4KIIIα by the small molecule A1 increased the number of longer-lived coated pits. CLTA-TagRFP+/+ cells stably expressing the PtdIns4P sensor EGFP-P4M(DrrA)-Aux1 were treated for 10 min with DMSO alone, or with DMSO and 100 nM A1, and then imaged by TIRF microscopy. The distributions of coated-structure lifetimes for the control (1,413 traces from 5 cells) and for A1 treated cells (864 traces from 14 cells) are shown. b, Inhibition of PI4KIIIα by A1 is reversible. CLTA-TagRFP+/+ cells expressing the PtdIns4P sensor EGFP-P4M(DrrA)-Aux1 were treated for 10 min with DMSO alone, or with DMSO and 100 nM A1, and then imaged by TIRF microscopy. To verify reversibility, the medium containing A1 was removed for 30 min and the cells also imaged by TIRF microscopy. c, Representative kymographs from a time series obtained by TIRF microscopy comparing recruitment of the PtdIns(4,5)P2 sensor EGFP-PH(PLCδ1)-Aux1 stably expressed in control CLTA-TagRFP+/+ cells and cells treated with the inhibitor A1. The PtdIns(4,5)P2 sensor was still recruited in the presence of the A1 inhibitor. d, The left panel shows efficient depletion of PIP5K1C mRNA measured by real-time quantitative PCR in CLΓA-TagRFP+/+ cells stably expressing the PtdIns(4,5)P2 sensor EGFP-PH(PLCδ1)-Aux1 (n = 3 independent experiments). The plots show averaged fluorescence intensity traces of the PtdIns(4,5)P2 sensor associated with endocytic clathrin-coated pits identified in 9 control and 11 PIPKIγ-KD cells, grouped in cohorts according to lifetimes. The numbers of analysed traces are shown above each cohort. Data are from time series obtained by TIRF microscopy. e, Genomic PCR analysis showing biallelic integration of the EGFP sequence into the SYNJ1 genomic locus in two clonal gene-edited SUM159 cell lines expressing EGFP-Synj1+/+ and CTLA-TagRFP+/+. Clone A1 was used in this study. f, The representative kymograph from a time series acquired by TIRF microscopy of SUM159 cells double gene-edited for EGFP-Synj1+/+ and CLTA-TagRFP+/+. Representative traces show the fluorescence intensity profile of CLTA-TagRFP (red) and the number of EGFP-Synjl molecules (green) associated with two endocytic events. Synj1 was recruited erratically throughout all stages of clathrin-coated pit formation. g, Knockout of Synjl in gene-edited CLTA-TagRFP+/+ SUM159 cells by CRISPR-Cas9 targeted knockout of SYNJ1. There were minor differences between wild-type and knockout cells in the fluorescence intensities of the recruited PtdIns4P sensor during the early (Cohen’s d = 0.29) and late burst stages (Cohen’s d = 0.12), comparing 1,388 and 1,150 traces from 16 control and 10 knockout cells, respectively. h, Knockdown of Synj1 in gene-edited CLTA-TagRFP+/+ SUM159 cells stably expressing the PtdIns4P sensor EGFP-P4M(DrrA)-Aux1. The left panel shows the efficiency, measured by real-time quantitative PCR, of SYNJ1 mRNA knockdown mediated by lentivirus transduction with shRNA (n = 5 independent experiments). Data in the central and right panels are from time series obtained by TIRF microscopy. There were no significant differences in the fluorescence intensity of the recruited PtdIns4P sensor from the early (Cohen’s d = 0.02) or late burst stages (Cohen’s d = 0.24), comparing 760 and 1,499 traces from 7 control and 9 knockdown cells, respectively. i, Knockdown of Synj1 in COS-7 cells stably expressing TagRFP-CLTA and the PtdIns4P sensor EGFP-P4M(DrrA)-Aux1. The left panel shows the efficiency, measured by real-time quantitative PCR, of SYNJ1 mRNA knockdown mediated by lentivirus transduction with shRNA (n = 3 independent experiments). Data in the central and right panels are from time series obtained by TIRF microscopy. There were no significant differences in the fluorescence intensity of the recruited PtdIns4P sensor from the early (Cohen’s d = 0.05) and late burst stages (Cohen’s d = 0.04), comparing 1,430 and 1,051 traces from 26 control and 25 knockdown cells, respectively. Data are mean ± s.d. in d (bar graph), g-i and mean ± s.e.m. in d (cohorts). Data are representative of at least two independent experiments. Cohen’s d with 95% CI are: [0.21, 0.37] and [0.04, 0.20] (g); [−0.07, 0.11] and [0.15, 0.33] (h); [−0.03, 0.12] and [−0.04, 0.12] (i). The EGFP channel in all the kymographs was shifted laterally by six pixels. Scale bars, 5 μm.

