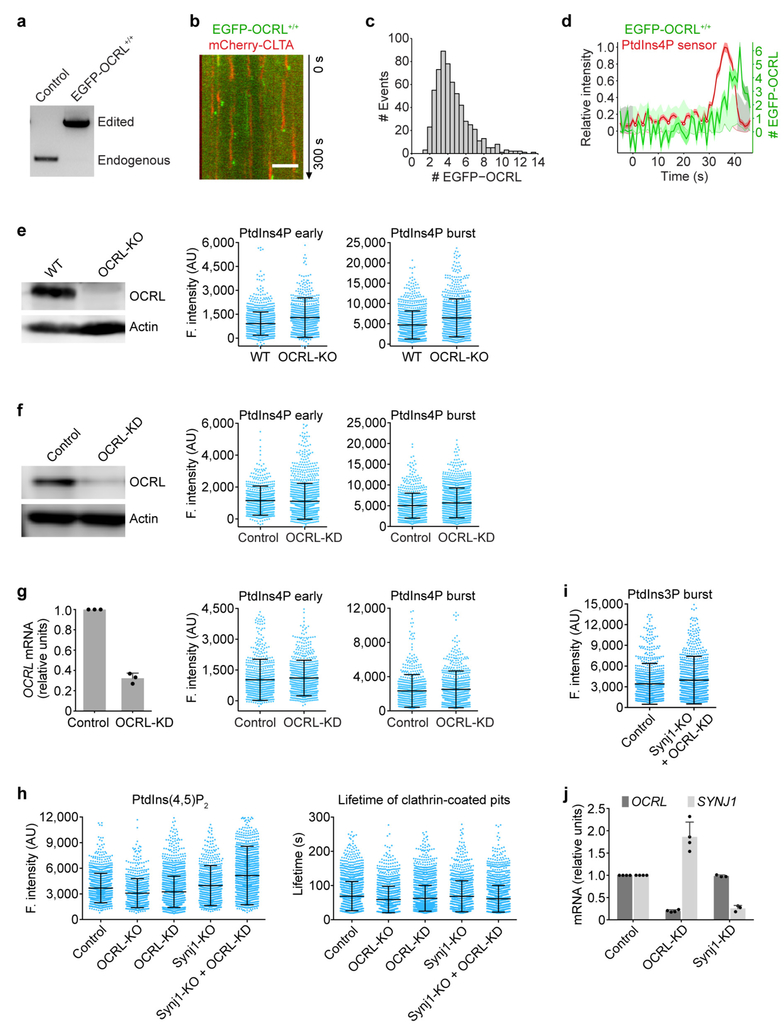
Extended Data Figure 7 |. Effect of interfering, individually or jointly, with the activities of inositol 5-phosphatases on the PtdIns4P and PtdIns(4,5)P2 content of endocytic clathrin-coated structures.
a, Genomic PCR analysis showing biallelic integration of the EGFP sequence into the OCRL genomic locus in the clonal gene-edited EGFP-OCRL+/+ SUM159 cell line. b, Representative kymograph from a time series obtained by TIRF microscopy of EGFP-OCRL+/+ cells transiently expressing mCherry-CLTA, showing the burst-like recruitment of EGFP-OCRL during vesicle uncoating. The EGFP channel was shifted laterally by six pixels. Scale bar, 5 μm. c, Distribution of the maximum number of EGFP-OCRL molecules recruited during uncoating to individual clathrin-coated vesicles in EGFP-OCRL+/+ cells (606 traces from 12 cells). d, Representative plot of one endocytic event showing fluorescence intensity traces of EGFP-OCRL (expressed as number of recruited molecules) and the PtdIns4P sensor mCherry-P4M(DrrA)-Aux1 from a time series obtained by TIRF microscopy of double gene-edited EGFP-OCRL+/+ cells expressing the PtdIns4P sensor. e, Expression of OCRL was eliminated in CLTA-TagRFP+/+ cells by CRISPR-Cas9 targeted knockout of OCRL as determined by western-blot analysis using antibodies against OCRL and actin (loading control). The fluorescence intensities of the recruited PtdIns4P sensor were obtained by comparing 1,177 and 1,015 traces from 10 control and 11 knockout cells, respectively. f, Reduction in the expression of OCRL mediated by siRNA in CLTA-TagRFP+/+ cells was confirmed by western blot analysis using antibodies against OCRL and actin. CLTA-TagRFP+/+ cells stably expressing the PtdIns4P sensor EGFP-P4M(DrrA)-Aux1 were treated with siRNA targeting either OCRL or a control sequence, and imaged by TIRF microscopy. No significant differences were observed in the fluorescence intensity associated with the recruitment of the PtdIns4P sensor during the early (Cohen’s d = 0.04) or late burst stages (Cohen’s d = 0.20) in 740 and 1,442 traces from 6 control and 5 knockdown cells, respectively. g, Knockdown of OCRL in COS-7 cells stably expressing TagRFP-CLTA and the PtdIns4P sensor EGFP-P4M(DrrA)-Aux1. Efficiency of OCRL depletion by siRNA was determined by real-time quantitative PCR (n = 3 independent experiments). PtdIns4P sensor recruitment data obtained from time series obtained by TIRF microscopy showed there were no significant differences in the fluorescence intensity of the recruited PtdIns4P sensor from the early (Cohen’s d = 0.09) and late burst stages (Cohen’s d = 0.09), comparing 709 and 848 traces from 15 control and 17 knockdown cells, respectively. h, Elimination of Synjl together with approximately 80% depletion of OCRL (Synjl-KO + OCRL-KD) increased the recruitment of the PtdIns(4,5)P2 sensor to coated pits and vesicles. Expression was reduced by CRISPR-Cas9 targeted knockout of OCRL or Synjl and by siRNA of OCRL in CLTA-TagRFP+/+ cells transiently expressing the PtdIns(4,5)P2 sensor EGFP-PH(PLCδ1)-Aux1. The cells were imaged by TIRF microscopy, and the plots show the maximum fluorescence intensity of the PtdIns(4,5)P2 sensor recruited at the approximate time of vesicle budding (1,436, 843, 2,142, 897 and 1,674 traces) and the lifetimes of the coated vesicles (1,851, 1,320, 2,534, 1,076 and 1,876 traces) from 10 control, 9 OCRL-KO, 11 OCRL-KD, 11 Synj1-KO and 11 Synj1-KO + OCRL-KD cells, respectively. The recruitment of the PtdIns(4,5) P2 sensor in Synj1-KO + OCRL-KD cells was significantly higher than control cells (Cohen’s d = 0.53). i, Elimination of Synj1 together with approximately 80% depletion of OCRL (Synj1-KO + OCRL-KD) did not affect recruitment of the PtdIns3P sensor (Cohen’s d = 0.17) to coated vesicles, comparing 918 and 990 traces from 14 control and 15 Synj1-KO + OCRL-KD cells, respectively. j, The expression levels of mRNA for OCRL and SYNJ1, measured by real time quantitative PCR, in control, OCRL-KD and Synj1-KD cells (n = 4 experiments for OCRL-KD and n = 3 experiments for Synj1-KD). Data are mean ± s.d. Data are representative of at least two independent experiments. Cohen’s d with 95% CI are: [−0.05, 0.12] and [0.11, 0.28] (f); [−0.01, 0.19] and [−0.01, 0.19] (g); [0.46, 0.60] (h); [0.08, 0.26] (i).

