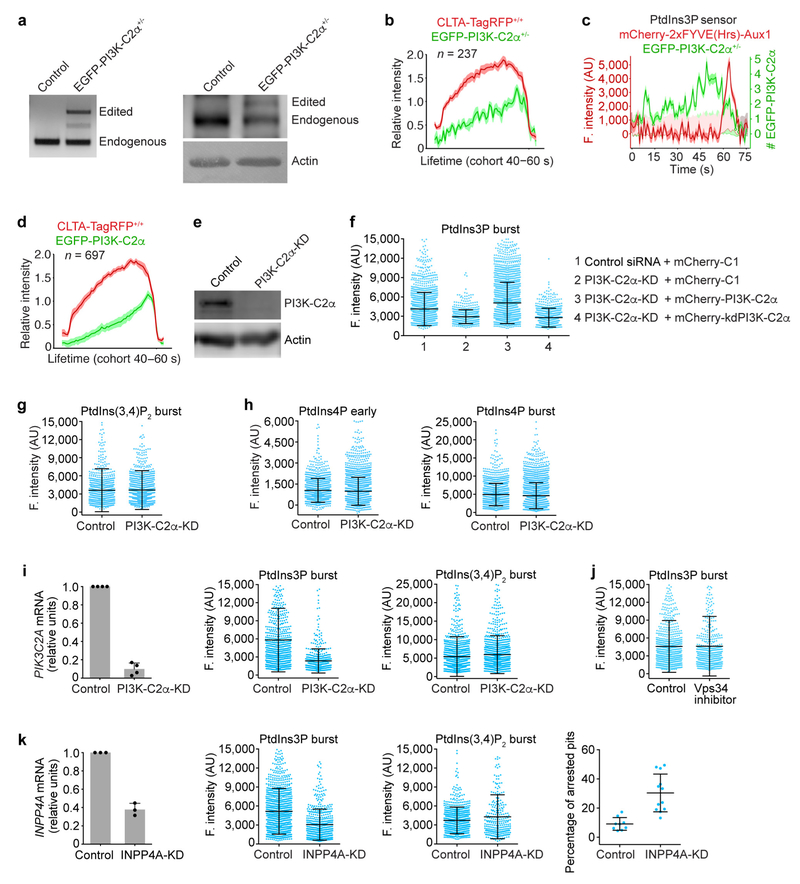
Extended Data Figure 8 |. No changes in the PtdIns(3,4)P2 content of endocytic clathrin-coated structures induced by interference with the activity of candidate inositol kinases.
a, Genomic PCR analysis (left) showing single allelic integration of the EGFP sequence into the PIK3C2A genomic locus in the clonal gene-edited EGFP-PI3K-C2α+/− SUM159 cells. Western blot analysis (right) of cell lysates probed with antibodies against PI3K-C2α and actin from SUM159 cells and EGFP-PI3K-C2α+/− cells show expression of EGFP-PI3K-C2α. b, Dual gene-edited EGFP-PI3K-C2α+/− and CLTA-TagRFP+/+ SUM159 cells were imaged by TIRF microscopy. The plots show averaged fluorescence intensity traces (mean ± s.e.m.) of CLTA-TagRFP and EGFP-PI3K-C2α corresponding to the cohort of coated pits lasting 40–60 s (237 traces from 6 cells). c, Representative plot from a time series obtained by TIRF microscopy of a EGFP-PI3K-C2α+/− cell transiently expressing the PtdIns3P sensor mCherry-2 × FYVE(Hrs)-Aux1. The tracing highlights the presence of a few copies of EGFP-PI3K-C2α at the time the PtdIns3P burst was detected. d, CLTA-TagRFP+/+ cells transiently expressing EGFP-PI3K-C2α were imaged by TIRF microscopy. The plots show averaged fluorescence intensity traces (mean ± s.e.m.) of CLTA-TagRFP and EGFP-PI3K-C2α corresponding to the cohort of coated pits lasting 40–60 s (697 traces from 10 cells). e, Reduction in the expression of PI3K-C2α following treatment with siRNA was confirmed by western blot analysis using antibodies against PI3K-C2α and actin. f, PI3K-C2α is partially required for the burst recruitment of the PtdIns3P sensor. SUM159 cells stably expressing the PtdIns3P sensor EGFP-2×FYVE(Hrs)-Aux1 were treated with control siRNA (1) or with siRNA specific for PI3K-C2α (2) to transiently deplete its expression. Cells treated with siRNA for PI3K-C2α were also transfected with either siRNA-resistant wild-type mCherry-PI3K-C2α (3) or kinase-deficient mCherry-kdPI3K-C2α (4) one day before TIRF imaging. Burst recruitment of the PtdIns3P sensor was prevented by depletion of PI3K-C2α (Cohen’s d = 0.52, comparing 2,150 and 674 traces from 10 control cells and 10 PI3K-C2α-KD cells, respectively) and was only rescued upon expression of wild-type mCherry-PI3K-C2α (Cohen’s d = 0.72, comparing 3,304 and 674 traces from 9 wild-type PI3K-C2α-expressing cells and 10 PI3K-C2α-KD cells, respectively) but not the kinase-deficient mCherry-kdPI3K-C2α (Cohen’s d = 0.11, comparing 1,113 and 674 traces from 12 kinase-deficient PI3K-C2α-expressing cells and 10 PI3K-C2α-KD cells, respectively). g, CLTA-TagRFP+/+ cells stably expressing the PtdIns(3,4)P2 sensor EGFP-2 × PH(TAPP1)-Aux1 were treated with control siRNA or with siRNA specific for PI3K-C2α to transiently deplete its expression. Data analysis from time series obtained by TIRF microscopy showed that PI3K-C2α depletion did not affect the maximum fluorescence intensity of the recruited PtdIns(3,4)P2 sensor (Cohen’s d = 0.05) determined for 1,136 and 1,579 traces from 10 control and 10 PI3K-C2α-KD cells, respectively. h, CLTA-TagRFP+/+ cells stably expressing the PtdIns4P sensor EGFP-P4M(DrrA)-Aux1 were treated with siRNA to knockdown the expression of PI3K-C2α, and time series were obtained by TIRF microscopy. PI3K-C2α depletion did not affect the fluorescence intensity of the recruited PtdIns4P sensor during the early (Cohen’s d = 0.07) or late burst stages (Cohen’s d = 0.09), determined for 1,394 and 2,316 traces from 11 control cells and 12 PI3K-C2α-KD cells, respectively. i, PI3K-C2α is partially required for the burst recruitment of the PtdIns3P sensor in COS-7 cells stably expressing TagRFP-CLTA together with the PtdIns3P sensor EGFP-2×FYVE(Hrs)-Aux1 or the PtdIns(3,4)P2 sensor EGFP-2 ×PH(TAPP1)-Aux1. The efficiency of PI3K-C2α depletion was determined by real-time quantitative PCR (left, n = 4 independent experiments). Analysis of time series obtained by TIRF microscopy shows a significant decrease in the recruitment of the PtdIns3P sensor (middle, Cohen’s d = 0.82) in cells depleted of PI3K-C2α (569 traces from 16 cells) when compared with cells treated with control siRNA (787 traces from 12 cells). PI3K-C2α depletion did not affect the maximum fluorescence intensity of the recruited PtdIns(3,4)P2 sensor (right, Cohen’s d = 0.10) determined for 1,229 and 1,158 traces from 24 control and 27 PI3K-C2α-KD cells, respectively. j, Inhibition of Vps34 by the small molecule VPS34-IN1. CLTA-TagRFP+/+ cells stably expressing the PtdIns3P sensor EGFP-2 × FYVE(Hrs)-Aux1 were treated for 1 h with 5 μM VPS34-IN1 and time series obtained by TIRF microscopy. Inhibition of Vps34 did not affect the maximum fluorescence intensity of the recruited PtdIns3P sensor during the late burst stage of recruitment (Cohen’s d = 0.01), comparing 853 and 522 traces from 9 control DMSO and 12 VPS34-IN1 treated cells, respectively. k, INPP4A is partially required for the burst recruitment of the PtdIns3P sensor. Efficiency of INPP4A depletion by siRNA in CLTA-TagRFP+/+ cells stably expressing the PtdIns3P sensor EGFP-2 × FYVE(Hrs)-Aux1 or the PtdIns(3,4)P2 sensor EGFP-2×PH(TAPP1)-Aux1 was determined by real-time quantitative PCR (left, n = 3 independent experiments, mean ± s.d.). Analysis of time series obtained by TIRF microscopy (middle) shows a significant decrease in the recruitment of the PtdIns3P sensor (Cohen’s d = 0.64) in cells depleted of INPP4A (511 traces from 12 cells) when compared with cells treated with control siRNA (1,179 traces from 9 cells). INPP4A depletion has a minor effect on the recruitment of the PtdIns(3,4)P2 sensor (Cohen’s d = 0.23) determined for 866 and 274 traces from 13 control and 14 INPP4A-KD cells, respectively. INPP4A-depleted cells (n = 12) had significantly more arrested pits than control cells (n = 9) (right, P = 0.0002, unpaired two-tailed Student’s í-test). Data are mean ± s.e.m. in b, d and mean ± s.d. in f-k. Data are representative of at least two independent experiments. Cohen’s d with 95% CI are: [0.43, 0.61], [0.64, 0.81] and [0.02, 0.21] (f); [−0.03, 0.12] (g); [0.00, 0.13] and [0.02, 0.15] (h); [0.71, 0.93] and [0.02, 0.18] (i); [−0.10, 0.12] (j); [0.53, 0.74] and [0.09, 0.37] (k).

