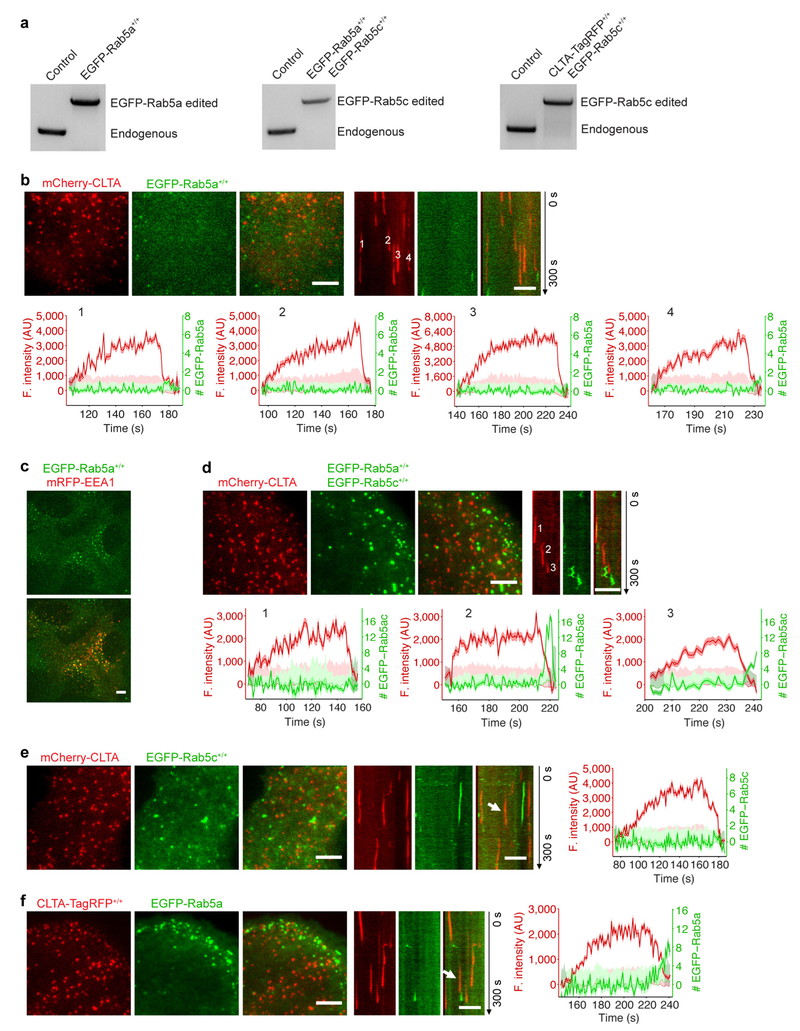
Extended Data Figure 9 |. Recruitment of Rab5 to clathrin-derived endocytic carriers.
a, Genomic PCR analysis showing biallelic integration of the EGFP sequence into the RAB5A genomic locus in gene-edited EGFP-Rab5a+/+ SUM159 cells (left), into the RAB5A and RAB5C genomic loci of EGFP-Rab5a+/+ EGFP-Rab5c+/+ SUM159 cells (middle), and into the RAB5C genomic locus of CLTA-TagRFP+/+ EGFP-Rab5c+/+ SUM159 cells (right), respectively. b, Rab5a was not recruited to clathrin-coated pits or vesicles; the onset of recruitment followed conclusion of the uncoating stage of endocytic clathrin-coated vesicles (events 1 and 4). EGFP-Rab5a+/+ cells transiently expressing mCherry-CLTA were imaged by TIRF microscopy. The representative kymograph and fluorescence intensity traces including the number of recruited Rab5a molecules are shown for four endocytic events. c, EGFP-Rab5a+/+ cells transiently expressing mRFP-EEA1 were imaged at the middle plane by spinning-disk confocal microscopy. d, Neither Rab5a nor Rab5c in gene-edited cells were recruited to clathrin-coated pits or vesicles; the onset of recruitment followed conclusion of the uncoating stage of endocytic clathrin-coated vesicles. EGFP-Rab5a+/+ and EGFP-Rab5c+/+ cells transiently expressing mCherry-CLTA were imaged by TIRF microscopy. The representative kymograph and fluorescence intensity traces including the number of recruited Rab5a and Rab5c molecules for three endocytic events are shown. e, Rab5c was not recruited to clathrin-coated pits or vesicles in gene-edited SVGA EGFP-Rab5c+/+ cells transiently expressing mCherry-CLTA. The cells were imaged by TIRF microscopy. A representative kymograph and fluorescence intensity traces for one endocytic event (arrow) are shown. f, Transiently expressed EGFP-Rab5a was not recruited to clathrin-coated pits or vesicles in CLTA-TagRFP+/+ SUM159 cells. Cells were imaged by TIRF microscopy. The representative kymograph and fluorescence intensity traces including the number of recruited Rab5a molecules for one endocytic event (arrow) are shown. The EGFP channel in all the kymographs with EGFP and mCherry or TagRFP overlaid was shifted laterally by six pixels. Data are representative of two independent experiments. Scale bars, 5 μm.

