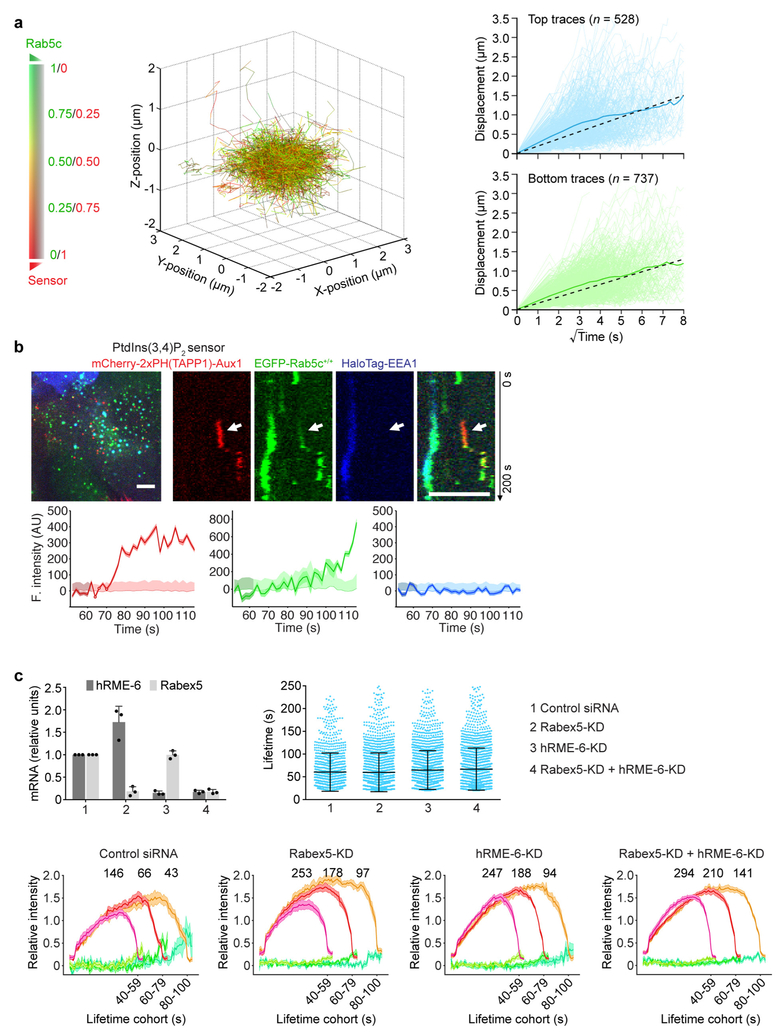
Extended Data Figure 10 |. Endocytic clathrin-coated vesicles acquire Rab5 before fusing with endosomes.
a, EGFP-Rab5c+/+ SUM159 cells transiently expressing the Auxl-based PtdIns(3,4)P2 sensor mCherry-2× PH(TAPP1)-Aux1 were imaged in 3D by lattice light-sheet microscopy (time series 300 s in duration, where each time point consisted of a stack of 41 planes spaced approximately 261 nm apart imaged with an approximately 2.5-s interval between stacks). The 3D plot (left) shows the 3D position of every one of the tracked PtdIns(3,4)P2-containing objects colour-coded from red to green (colour bar) as the linear ratio of recruited PtdIns(3,4)P2 sensor with respect to the amount of Rab5c content changed over time. The 3D data are from 1,265 traces detected in 16 cells from 2 independent experiments. The directed movement of the traces starting at (0,0,0) becomes apparent when the capture of Rab5c becomes significant (left; Supplementary Video 7). The panel on the right shows the displacement of PtdIns(3,4)P2-containing objects versus the square root of time traces. The objects tracked at the top and bottom of the cell are shown in light blue and green, and their averages are shown in dark blue and green, respectively. The PtdIns(3,4)P2-containing objects tracked at the top and bottom of the cell (right) display a linear dependence of displacement with the square root of time consistent with non-directional 3D Brownian motion. The individual traces are depicted in light blue and green and the plots include the corresponding average displacements calculated for each time point (dark colour) and their fitted linear regressions (dashed lines with slopes of 0.19 ± 0.02 and 0.16 ± 0.02, respectively). b, Rab5 in endocytic carriers derived from clathrin-coated vesicles does not contain the early endosomal marker EEA1. EGFP-Rab5c+/+ SUM159 cells transiently expressing HaloTag-EEA1 and the PtdIns(3,4)P2 sensor mCherry-2×PH(TAPP1)-Aux1 were briefly incubated with the HaloTag ligand labelled with the Janelia Fluor 646 dye and then imaged at their bottom surface by spinning-disk confocal microscopy. The representative kymograph and fluorescence intensity traces for one endocytic event (arrow) are shown. Data are representative of two independent experiments. Scale bars, 5 μm. c, Depletion efficiency of the Rab5 GEFs hRME-6 or Rabex5 mRNA by siRNA in double gene-edited CLTA-TagRFP+/+ and EGFP-Rab5c+/+ SUM159 cells was determined by realtime quantitative PCR (upper left panel, n = 3 independent experiments, mean ± s.d.). The control or knockdown cells were imaged by TIRF microscopy. Rabex5 or hRME-6 depletion has a minor effect on the lifetime distributions of coated pits as determined from 1,097, 1,793, 1,829 and 1,782 traces (mean ± s.d.) imaged in 8 control, 11 Rabex5-KD, 10 hRME-6-KD and 11 Rabex5-KD + hRME-6-KD cells, respectively (upper right panel; Cohen’s d = 0.01, 0.11 and 0.15 with 95% CI [−0.06, 0.09], [0.03, 0.18] and [0.07, 0.22], respectively). The plots (lower panels) show averaged fluorescence intensity traces (mean ± s.e.m.) of EGFP-Rab5c (green) recruited during the uncoating stage of endocytic clathrin-coated vesicles (red) in control or knockdown cells. The numbers of analysed traces are shown above each cohort.

