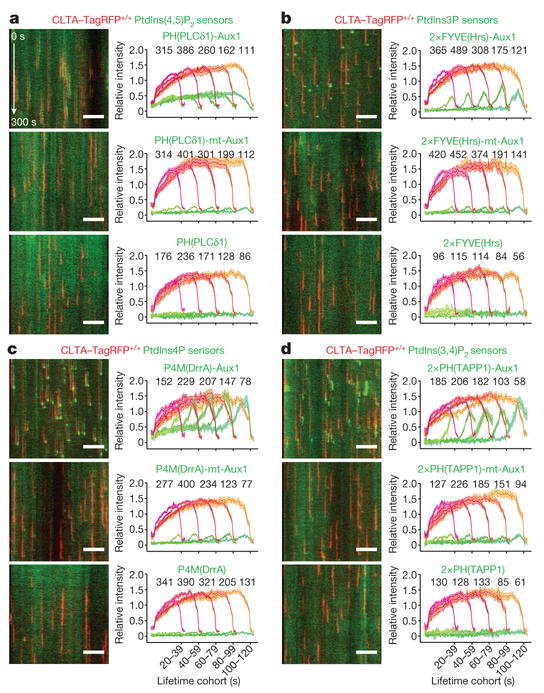
Figure 2 |. Recruitment of phosphoinositide sensors reflects lipid composition of endocytic clathrin-coated structures.
Bottom surfaces of CLTA-TagRFP+/+ cells transiently expressing EGFP-tagged sensors specific for PtdIns(4,5)P2 (a), PtdIns3P (b), PtdIns4P (c) and PtdIns(3,4)P2 (d), imaged by TIRF microscopy every 1 s for 300 s and traces analysed by automated 2D tracking. The representative kymographs cover the entire time series. The EGFP channel in the kymographs was shifted laterally by six pixels. The plots show averaged fluorescence intensity traces (mean ± s.e.m.) of CLTA-TagRFP and phosphoinositide sensor, grouped by cohorts according to lifetimes. The numbers of analysed traces are shown above each cohort; the numbers of cells were 12, 10 and 11 (a); 12, 9 and 10 (b); 9, 10 and 12 (c); and 21, 8 and 10 (d). Data are representative of at least two independent experiments. Scale bars, 5 μm.

