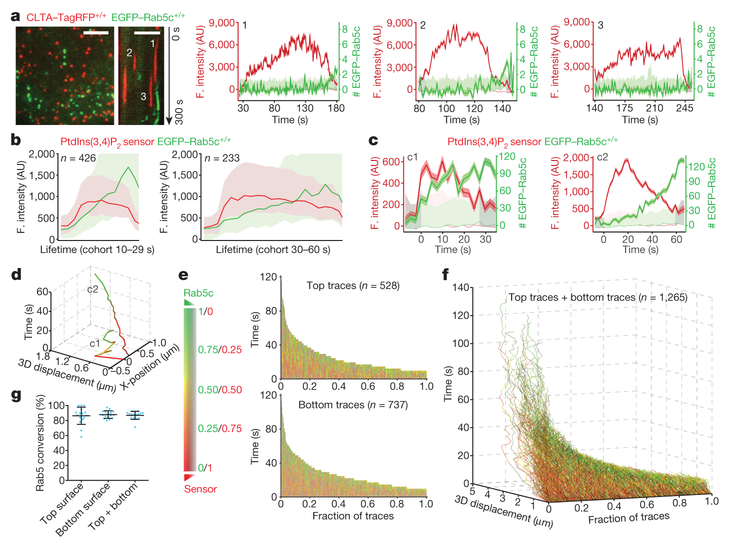
Figure 4 |. Recruitment of Rab5 to clathrin-derived endocytic carriers.
a, Left, image and kymograph from TIRF microscopy (300 s, 1-s intervals, single-EGFP sensitivity) near the leading edge of the bottom surface of a cell double gene-edited for CLTA-TagRFP+/+ and EGFP-Rab5c+/+, showing the absence of Rab5c in endocytic clathrin-coated pits; EGFP signal in the kymograph shifted laterally by six pixels. Scale bars, 5 μm. Right, representative fluorescence intensity traces for clathrin and Rab5c (thicker lines), corresponding local backgrounds (thin lines) and number of recruited Rab5c molecules. Dark and light shaded areas: estimated uncertainties for detected intensity (s.d.) and significance threshold above background (~2 s.d.). Intensities during the intervals preceding and following the first and last detected signals (shaded regions) returned to background, confirming detection of independent events. Representative data from three independent experiments. b,3D lattice light-sheet microscopy imaging of gene-edited SUM159 cells expressing EGFP-Rab5c+/+ and the PtdIns(3,4)P2 sensor mCherry-2×PH(TAPP1)-Aux1. Averaged fluorescence intensity traces (mean ± s.e.m.) from two independent experiments (16 cells) showing recruitment profiles for traceable events lasting 10–29 s (left, 426 traces) and 30–60 s (right, 233 traces). c, Representative fluorescence intensities from two carriers (c1 and c2) from the cohort in b, computationally tracked in 3D until the object entered a region of high Rab5c-positive density. d, Tracks for c1 and c2, colour-coded as the Rab5c to PtdIns(3,4) P2 sensor ratio, showing time course of 3D displacement from initial positions. e, Cumulative time distributions for all 3D tracks regardless of lifetimes, colour-coded as the Rab5c to PtdIns(3,4)P2 sensor ratio; events grouped into those from top and bottom (attached) cell surfaces (16 cells). f, Distribution of 3D displacements for all 3D tracks from e. g, Recruitment of Rab5c by PtdIns(3,4)P2-containing, clathrin-derived endocytic carriers, grouped as events emanating from the top, bottom or both cell surfaces. Each data point represents results for a single cell (mean ± s.d., 16 cells).

