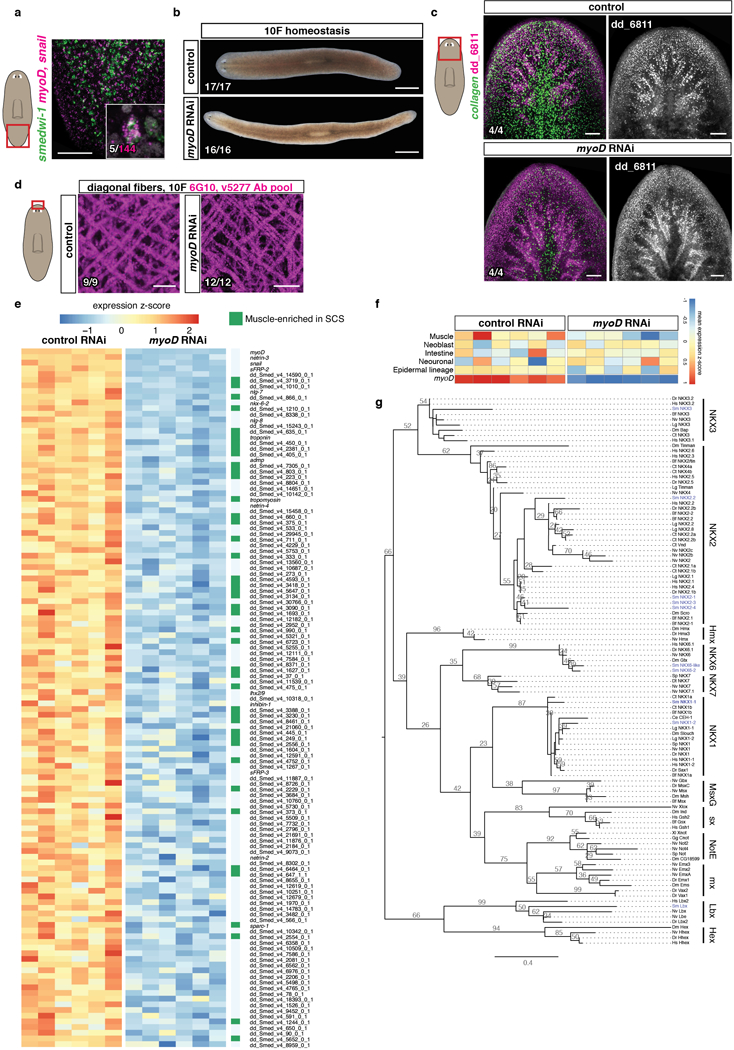
Extended data Figure 1. myoD is a myogenic gene in planarians specific for longitudinal muscle fibers.

a, Co-expression of myoD (myoD and snail probes pooled) and the neoblast marker smedwi-1 (5 animals, 2 experiments. In white, double positive cells). b, Reduced expression of BWM (collagen+) but not intestinal muscle (dd_6811+17) in an uninjured myoD(RNAi) animal after 10 RNAi feedings. c, Comparable diagonal fiber numbers in myoD and control RNAi animals. Scale bars, 10 μm. d, Heatmap shows genes downregulated (log2 fold-change<0, padj-value<0.001) in uninjured myoD(RNAi) animals. In green, muscle-enriched genes from single cell RNA-seq data17 (AUC>0.8) (43/123 genes). Each column is a replicate. e, Heatmap shows other tissue-enriched gene expression is not affected in myoD(RNAi) animals. Mean of tissue-enriched genes (AUC>0.817) is used. Each column is a replicate. f, Phylogenetic analysis of homeodomain transcription factors. Accession numbers are in SI Table 2. lhx2/9 tree previously reported36. Tree shows 105 proteins from diverse organisms. Maximum likelihood analyses were run using PhyML with 100 bootstrap replicates. All ML bootstrap values >20 are shown. Bf:Branchiostoma floridae; Ce:Caenorhabditis elegans; Ct:Capitella teleta; Dm:Drosophila melanogaster; Dr:Danio rerio; Dt:Discocelis tigrina; Gg:Gallus gallus; Hs:Homo sapiens; Lg:Lottia gigantea; Nv:Nematostella vectensis; Od:Oikopleura dioica; Sm:Schmidtea mediterranea; Sp:Strongylocentrotus purpuratus; Xl:Xenopus laevis. All FISH panels are representative images of 2 independent experiments. Bottom left number: animals with phenotype out of total tested. Anterior, up. Scale bars, 100 μm unless indicated.
