Fig. 2.

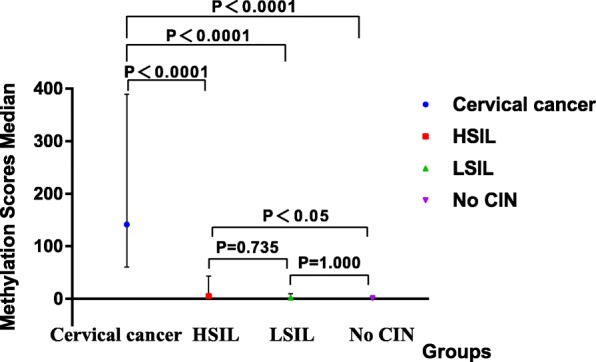
Methylation scores median of different cervical lesions. In this box-and-whisker plot, the boxes represent median values; the upper and lower lines outside the boxes represent the 25th and 75th percentiles, respectively

Methylation scores median of different cervical lesions. In this box-and-whisker plot, the boxes represent median values; the upper and lower lines outside the boxes represent the 25th and 75th percentiles, respectively