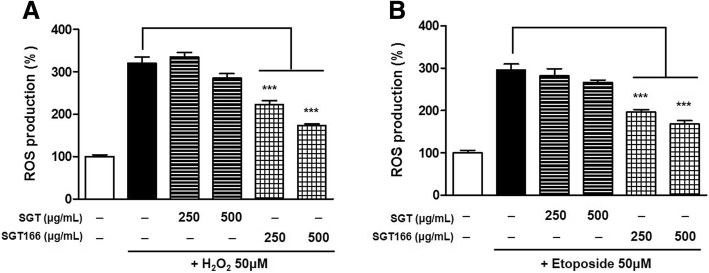
Fig. 5.
The inhibitory effects of SGT and SGT166 against toxicant-induced ROS production in SH-SY5Y cells. Total ROS levels were measured using the H2-DCFDA method. Cells were pretreated with SGT or SGT166 for 6 h, and then labeled with 50 μM H2-DCFDA for 30 min. Cells were separately exposed to 50 μM H2O2 (a) and 50 μM etoposide (b), analyzed immediately using a fluorescent plate reader. The values shown are means ± SE (n = 5). ***P < 0.001 versus the cells treated with toxicant only

