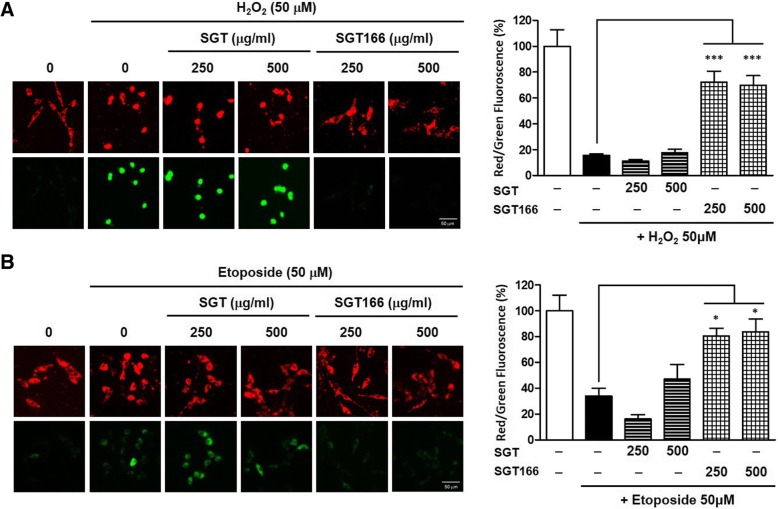
Fig. 6.
The protective effects of SGT and SGT166 against toxicant-induced disruption of MMP in SH-SY5Y cells. MMP was assessed by confocal microscopy using JC-1 staining. Cells were pretreated with SGT or SGT166 for 6 h, and then separately exposed to 50 μM H2O2 (a) and 50 μM etoposide (b) for 1 h. After incubated with JC-1 for 15 min, the cells were observed under 132x magnification. Representative images showing red fluorescence (aggregated form) and green fluorescence (monomeric form). Scale bar = 50 μm. The graph shows the red/green fluorescence intensity ratio quantitative analysis. The values shown are means ± SE (n = 5). *P < 0.05 and ***P < 0.001 versus the cells treated with toxicant only

