Figure 5.
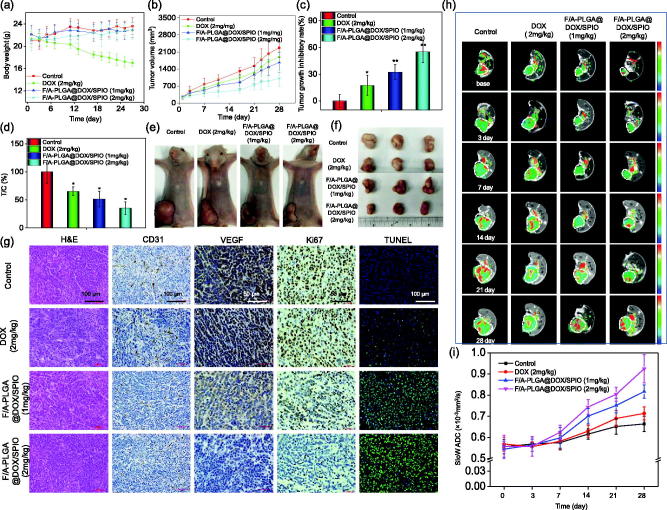
In vivo therapeutic effects of F/A-PLGA@DOX/SPIO NPs in A549-bearing mice. Body weight (a) and tumor volume (b) changes of A549 tumor-bearing mice following different treatments. The tumor growth inhibitory rate (c) and relative tumor proliferation rate (d) of different groups of A549 tumor-bearing mice at 28 days. Photographs of size and morphology of tumors (e) and tumor gross specimens (f) from different groups of mice 28 days after the treatment (scale: 1 cm). Bars with different characteristics are statistically different at the p < .05 level. *p < .05 vs. control. **p < .01 vs. control. (g) H&E, immunohistochemically analysis, and TUNEL staining in tumor sections from different treatment groups. Original magnification of H&E, CD31, and TUNEL: 20×; original magnification of Ki67 and VEGF: 40×. (h) MR slow ADC maps of A549-bearing mice after different treatment groups at different times. Tumor sites are circled by dashed lines. (i) Broken line chart of the changing trend of tumor slow ADC value for each group at different times. Values expressed as means ± SD (n ≥ 15).

