Figure 4.
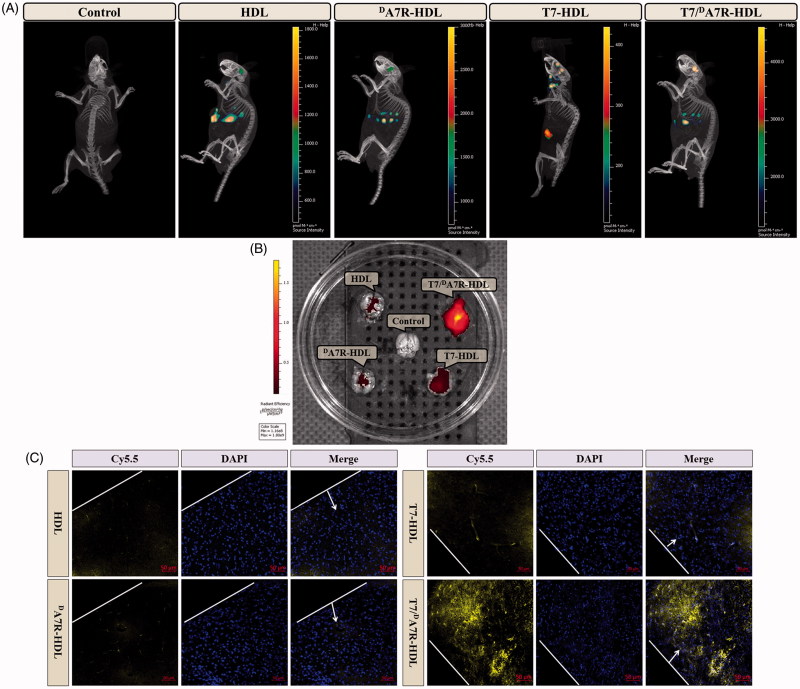
In vivo targeting ability. Biodistribution of Cy5.5 contained in various formulations in mice bearing intracranial C6 glioma determined by an IVIS® Spectrum-CT (A) Ex vivo fluorescence imaging of the brain (B) Distribution of Cy5.5 in the brain of mice bearing intracranial C6 glioma determined by a CLSM (C) The red represents Cy5.5 (red) and the nuclei were stained by DAPI (blue). The white line showed the margin of intracranial glioma and the arrow pointed the glioma cells. Scale bars represent 50 µm.

