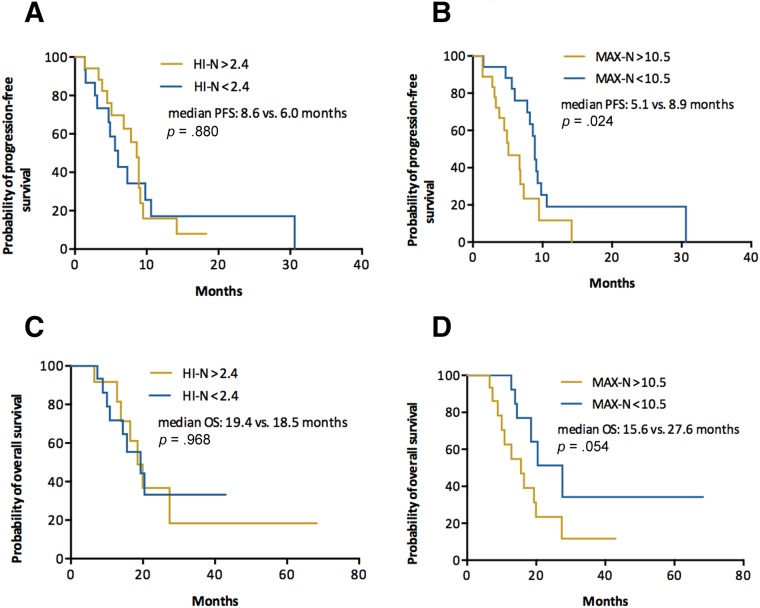
Figure 3.
Patients with nonvisceral metastasis. Kaplan‐Meier curves of PFS (A, B) and OS (C, D) stratified by HI‐N (A, C) and MAX‐N (B, D).
Abbreviations: HI, heterogeneity index; MAX, maximum of standard uptake value across metastatic lesions; ‐N, nonvisceral lesions; OS, overall survival; PFS, progression‐free survival.

