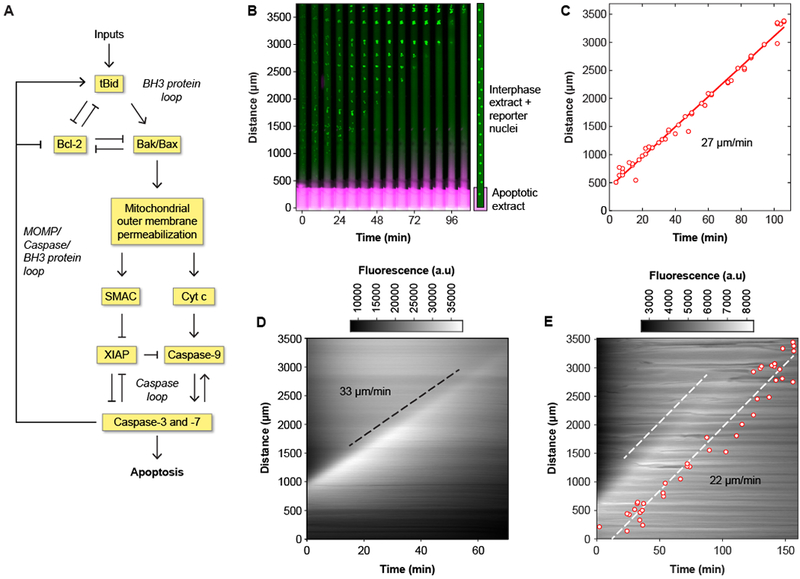
Fig. 1. Apoptosis propagates in interphase-arrested cytoplasmic Xenopus laevis egg extracts by trigger waves.

(A) The control circuit for apoptosis, adapted from previously published work (24–28). (B) Time-lapse montage of GST-GFP-NLS filled nuclei (green) in a cytoplasmic extract in a Teflon tube with its lower end in contact with an apoptotic extract reservoir. The extract in the reservoir is marked with 10-kD dextran-Texas Red dye, shown in magenta. A time-lapse video of this experiment can be found in movie S1. (C) Correlation between timing and position of nuclear disappearance for the experiment shown in panel (B). The solid red line is a linear least squares fit to the data. The propagation speed (the slope of the fitted line) is 27 μm/min. (D) Kymograph showing the spatial propagation of caspase-3 and/or caspase-7 activity (indicated by R110 fluorescence) in a crude cytoplasmic extract. The black dashed line was manually fitted to the fluorescence front, and it yielded a propagation speed of 33 μm/min. (E) R110 fluorescence and nuclear disappearance, using GST-mCherry-NLS as a nuclear marker, measured in the same tube. Note that the presence of the nuclei makes the R110 fluorescence less diffuse than it is in panel D. One dashed line is manually fitted to the fluorescence front, and the other is a least-squares fit to the nuclear data. The propagation speed was 22 μm/min for both waves.
