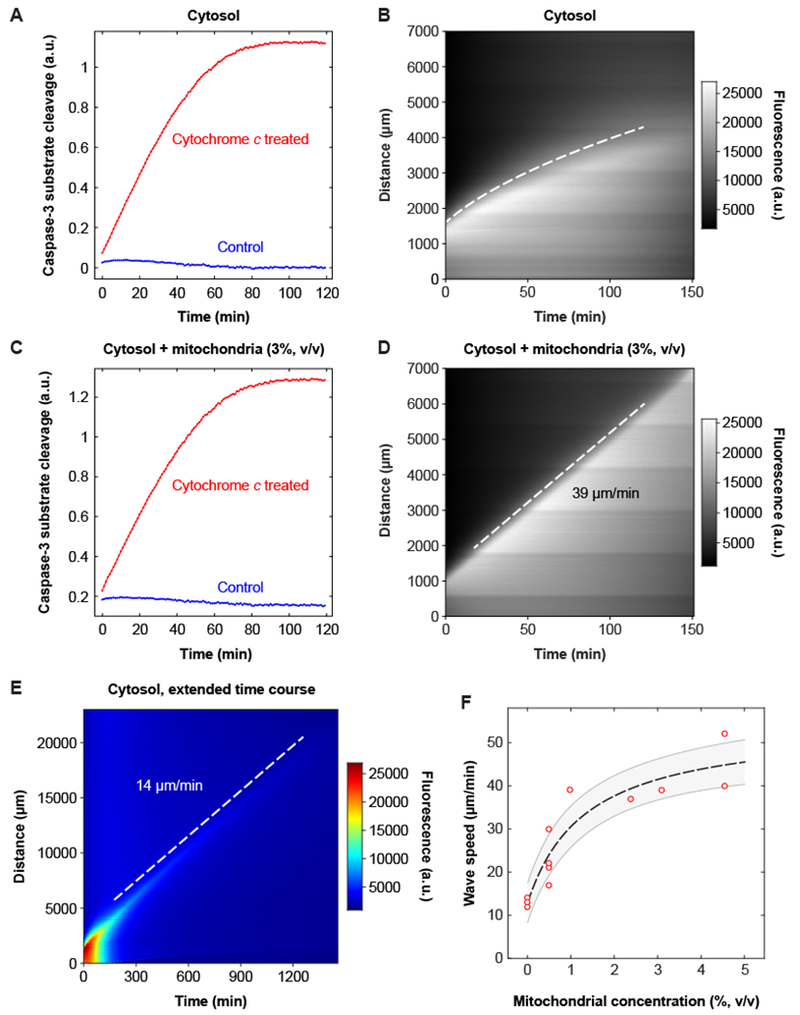
Fig. 2. The speed of the apoptotic trigger wave depends upon the concentration of mitochondria.

(A, B) Cytosolic extract. Panel A shows activation of caspase-3 and/or caspase-7, by a chromogenic assay, and panel B is a kymograph showing diffusive spread of caspase-3/7 activation, as read out by the Z-DEVD-R110 probe, over this time scale and distance scale. The dashed curve was obtained by defining an equal-fluorescence isocline, replotting the isocline on a distance squared vs. time plot, carrying out a linear least squares fit, and then transforming the fitted line for plotting on the original distance vs. time axes. Further details are provided in figure S4. (C, D) Reconstituted extract from the same experiment. Panel C shows activation of caspase-3 and/or −7 and panel D is a kymograph, here showing trigger wave propagation of caspase activation. (E) Slow apoptotic trigger waves detected in cytosolic extracts. This kymograph shows a cytosolic extract incubated for 24 h in a 3 cm tube. R110 fluorescence is displayed here on a heat map scale to allow the shape of the wave front to be appreciated both early and late in the time course. (F) Wave speed as a function of mitochondrial concentration. Data are from 18 tubes and 8 independent experiments (there are 9 overlapping data points with 0% mitochondria). The dashed line is a Michaelian dose-response curve given by the equation ; the fitted parameters are y0 = 13.0±1.4 μm/min, ymax = 41.3±6.1 μm/min, and K = 1.3±0.6% (means ± S.E.), and r2 = 0.98. The grey region is the standard error (68.2% confidence interval) single prediction confidence band calculated with Mathematica 11.1.1.
