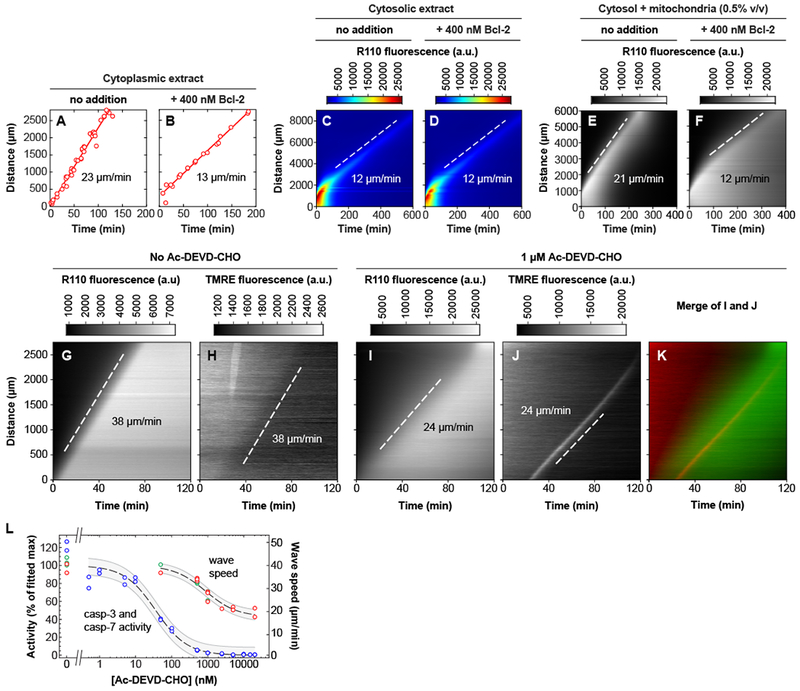
Fig. 3. Both GST-Bcl-2 addition and inhibition of caspase-3 and caspase-7 affect the speed of the trigger waves.

(A, B) GST-Bcl-2 reduces the speed of trigger waves in cytoplasmic extracts. Apoptosis was monitored by the disappearance of reporter nuclei containing GST-mCherry-NLS. (C, D) GST-Bcl-2 has no effect on the speed of trigger waves in cytosolic extracts. Apoptosis was detected with Z-DEVD-R110, whose fluorescence can be activated by caspase-3 or caspase-7. The pseudocolor heat map scale allows both the initial and final shapes of the wave front to be discerned. (E, F) GST-Bcl-2 reduces the speed of trigger waves in extracts reconstituted with cytosol and mitochondria (0.5% v/v). (G-K) Inhibition of caspase-3 and −7 slows trigger waves. The reporters were Z-DEVD-R110 and the mitochondrial probe TMRE. (G, H) Cytosolic extract reconstituted with mitochondria (2.4% v/v). (I-K) A reconstituted extract treated with the caspase inhibitor Ac-DEVD-CHO (1 μM). In experiments with higher concentrations of Ac-DEVD-CHO, a brief (~10 min) period when the TMRE wave appeared to be parabolic rather than linear was seen (figure S9). (L) Inhibition of caspase-3 and −7 activity, and slowing of trigger waves, as a function of Ac-DEVD-CHO concentration in cytosolic extracts reconstituted with mitochondria (2.4% v/v). Blue data points show caspase activities, measured in extracts diluted 1:20. Green data points indicate wave speeds estimated from Z-DEVD-R110 fluorescence, and red points from TMRE fluorescence. The curves are fits to a Michaelian inhibition function, , where y is the caspase activity or trigger wave speed, x is the Ac-DEVD-CHO concentration, and y0, ymax, and K are parameters determined by fitting the data. For the caspase activity curve, the fitted parameter values were: y0 = 0.1 ± 2.5; ymax = 100 ± 3; and K = 36 ± 8 nM (mean ± S.E.). For the wave speed curve, the fitted parameter values were y0 = 17 ± 1 μm/min; ymax = 40 ± 1 μm/min; and K = 856 ± 160 nM (mean ± S.E.). The shaded regions are the standard error (68.2% confidence interval) single prediction confidence bands calculated with Mathematica 11.1.1.
