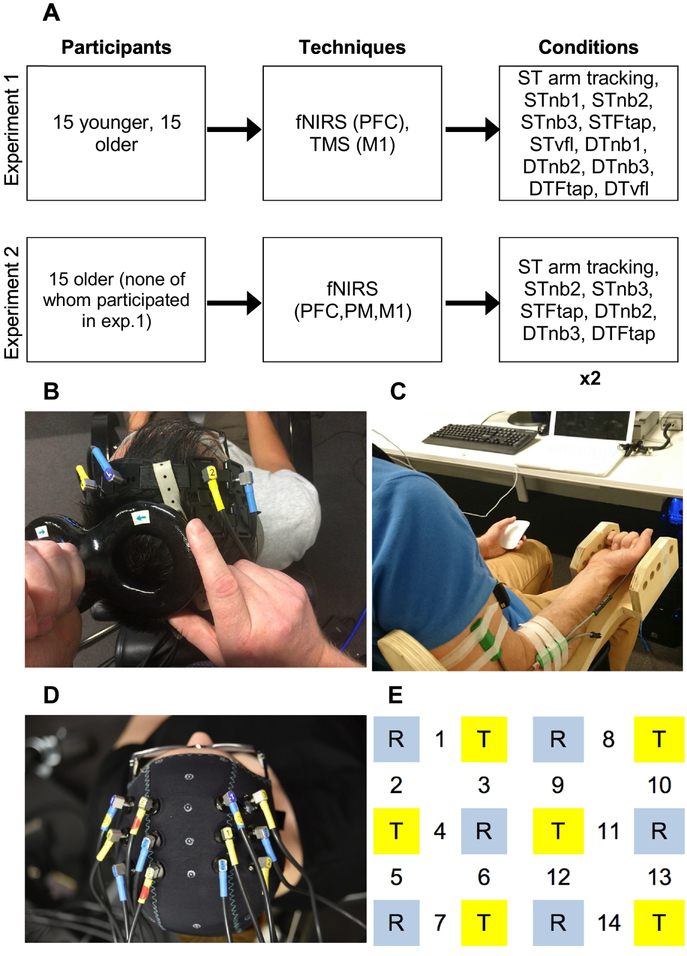
Figure 1. Study overview and experimental setup.
Figure 1A shows the methods used for experiments 1&2. ×2 below indicates that each condition was performed twice in experiment 2. Figure 1B shows fNIRS channels 1&2 over the left and right PFC, and the TMS coil applying pulses to the BB representation of the left M1 (experiment 1). Figure 1C shows arm tracking and concurrent n-back task performance (responding with left hand mouse click). Figure 1D shows fNIRS montage in experiment 2, and Figure 1E zooms in on this optode montage. T (yellow squares) = transmitter; R (blue squares) = receiver. Channels 1–3 (left hemisphere) and 8–10 (right hemisphere) measured activity within PFC, channels 4–6 and 11–13 measured activity within PM, and channels 7 and 14 measured activity within M1. PFC, PM, and M1 appear in ‘techniques’ box to indicate the brain regions that were measured by each technique, in each experiment.

