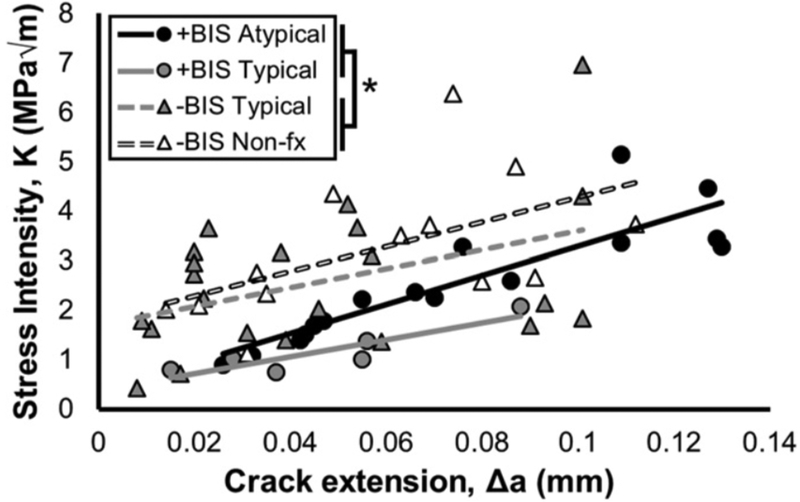
Figure 4.
Fracture resistance R-curves of stress intensity (K) as a function of crack extension, Δa, based on in situ fracture toughness tests. Lines represent a fit of the data for each group. Tissue from patients treated with bisphosphonates (+BIS groups) was less tough than that from bisphosphonate-naïve patients (−BIS groups); *P = 0.01. In addition, tissue from patients without fractures (−BIS Nonfx) was tougher than that from patients with typical or atypical fractures (P = 0.03 by linear fixed effects model). Reproduced with permission (Proceedings of the National Academy of Sciences of the United States of America). [21]

