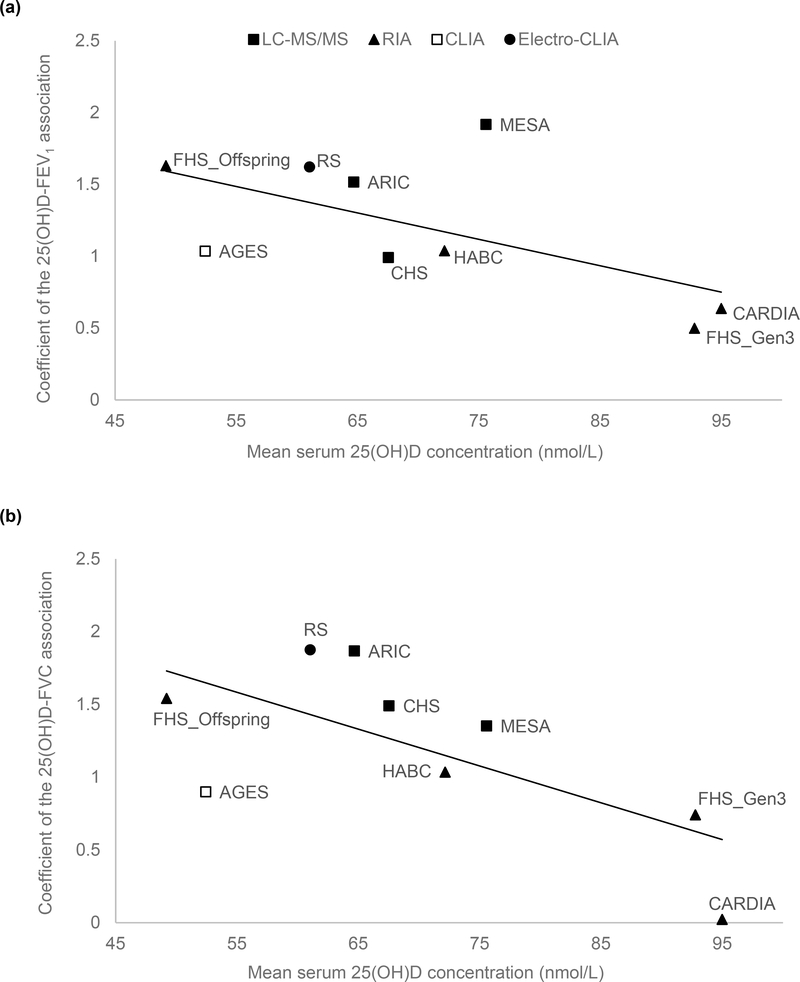
Figure 2. Meta-regression of mean serum 25(OH)D levels against the association estimates of 25(OH)D with PFT in nine European ancestry cohorts in the CHARGE Consortium.
(A) FEV1 outcome (coefficient unit: mL per 1 nmol/L 25(OH)D), and (B) FVC outcome (coefficient unit: mL per 1nmol/L 25(OH)D). The modifier is mean serum 25(OH)D level of each nine cohorts. A linear regression line is present for each sub-figure, with a meta-regression p-value of 0.0006 for the FEV1 outcome, and 0.005 for the FVC outcome. The figure also shows the measurement method for the serum 25(OH)D assay (legend shows symbols for each of the 4 assay methods).

