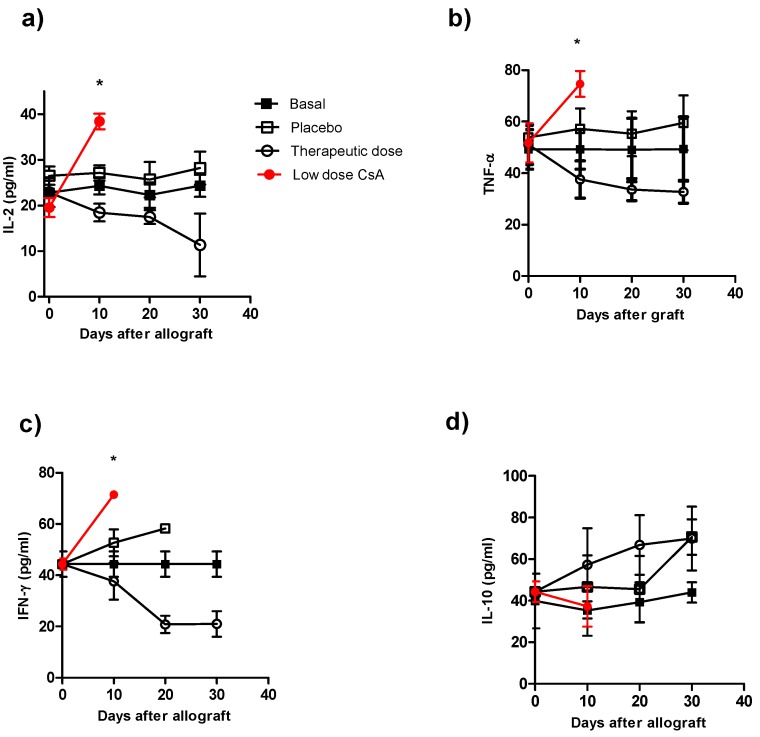
Figure 3.
Kinetics of cytokine production during course of allograft in ICR mice receiving different treatment of CsA. Individual mice were bleeding at different times after skin allograft, and sera were processed for cytokine detection by ELISA a) IL-2 detection, b) TNF-α detection, c) IFN-γ detection and d) IL-10 detection in sera of from animals receiving allografts and CsA treatment. The data are the mean of two independent experiments at each time point. An asterisk indicates statistically significant (*P < 0.05) differences between the groups receiving CsA with respect to basal and placebo.

