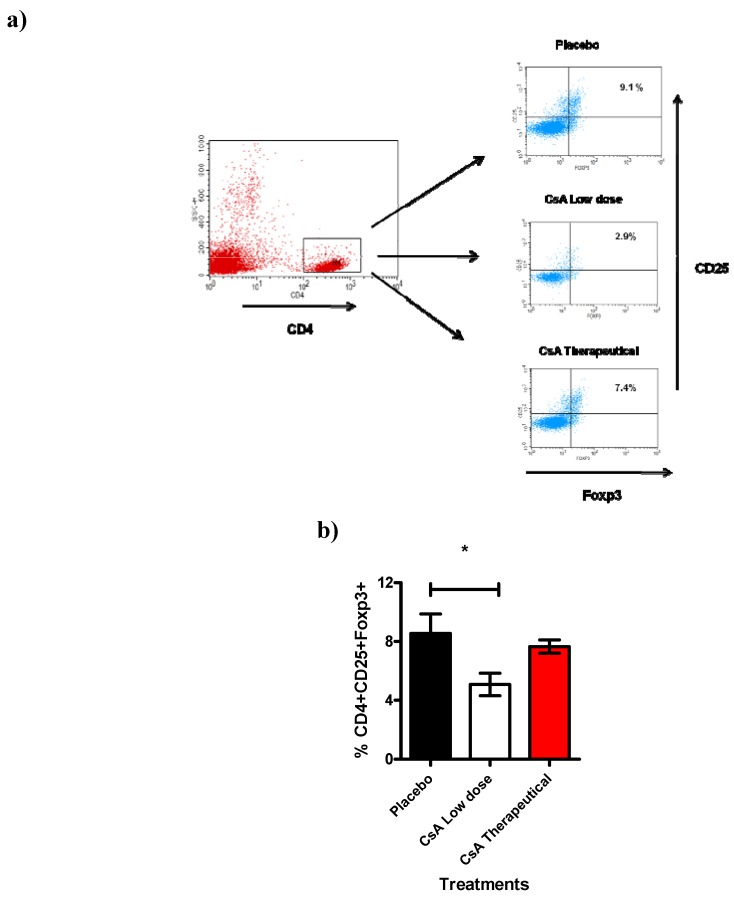
Figure 7.
Treg cell population is affected by Low dose of CsA. This figure shows the flow cytometric analysis of T regs population from the spleen. a) Representative dotplot indicating the percentage of CD25+Foxp3+ cells obtained from the gate of CD4+ cells from spleen of grafted mice under different treatments (7 days after graft). b) Analysis of total Tregs, data are representative of two independent experiments, bars indicate standard deviation, n = 4 mice per group. *P < 0.02 according to one way ANOVA.

