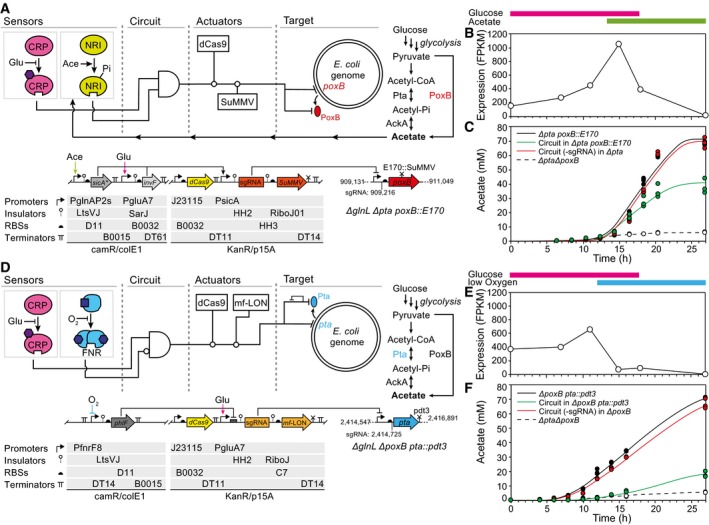
The genetic circuit designed to control poxB is shown. The strain genotype is shown, including the positions targeted by the sgRNA and the SuMMV protease.
The transcription of
poxB over time (
Escherichia coli MG1655
∆glnL), as calculated from RNA‐seq data (
Materials and Methods). The colored bars indicate the times at which the glucose/acetate sensors will be on based on metabolite measurements. It should be noted that these are right‐shifted compared to Fig
2 due to slower growth of the tested strains.
The production of acetate is shown over time for E. coli MG1655∆glnL∆pta poxB::E170 (black) as compared to the same strain containing the complete circuit (green). A version of the circuit in which the sgRNA is targeted to rfp (not present in the system) and is tested in MG1655∆glnL∆pta (containing an untagged poxB) is shown as a control (red). Empty circles connected by the dashed line represent MG1655∆glnL∆pta∆poxB.
The genetic circuit design to control pta is shown.
The transcription of
pta over time (
E. coli MG1655
∆glnL), as calculated from RNA‐seq data (
Materials and Methods). The colored bars indicate the times at which the glucose/oxygen sensors will be on based on metabolite measurements.
The production of acetate is shown over time for E. coli MG1655∆glnL∆poxB pta::pdt3 as compared to a strain containing the complete circuit (green) tested in same strain. A version of the circuit in which the sgRNA is targeted to rfp (not present in the system) and is tested in MG1655∆glnL∆poxB (containing an untagged pta) is shown as a control (red). Empty circles connected by the dashed line represent MG1655ΔglnLΔptaΔpoxB.
Data information: In (C, F), three experiments were performed and all individual data points are plotted. The lines are fit to averages of these data. Growth curves for each strain are shown in
Appendix Fig S16. The corresponding plasmid maps and parts sequences for (A, D) are provided in
Appendix Fig S17 and Table S2.