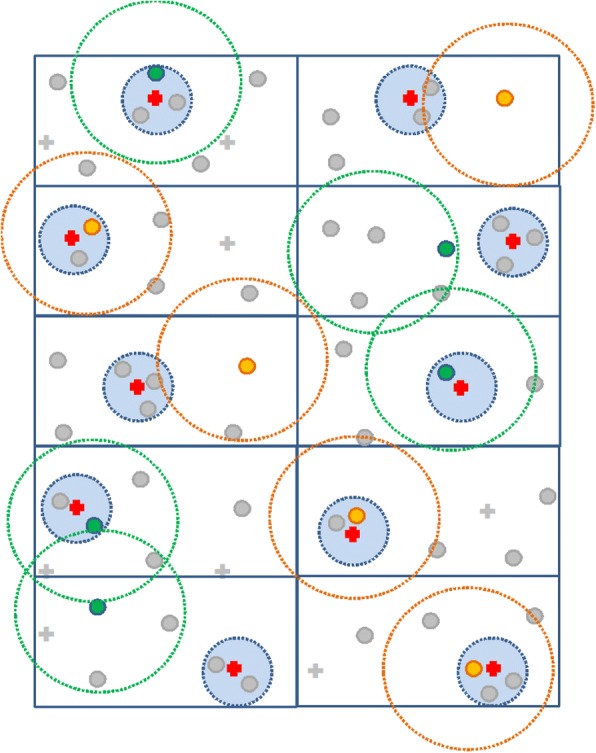
Fig. 1.

Schematic diagram for cluster selection criteria in the randomization  Multicomponent intervention cluster;
  Usual care cluster;
  Government clinic nearest to the randomized cluster;
  Non-randomized cluster;
  Government clinic outside 10 km radius of randomized cluster. Rectangles represent administrative units. Dotted line surrounding a cluster represents a 10-km radius to the cluster. Dotted line surrounding a government clinic represents a 2-km radium to the clinic. No usual care clusters are within a 10-km radius of MCI clusters. Any usual care cluster should not be nearer to a MCI government clinic than its own; similarly, any MCI cluster should not be nearer to a usual care government clinic than its own
