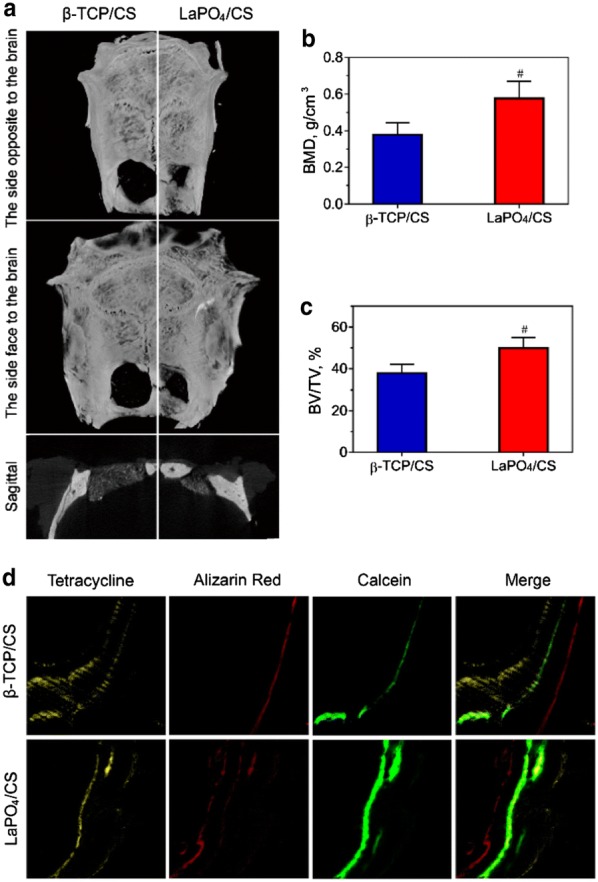
Fig. 8.

a Micro-CT results of 3D reconstructed and 2D sagittal images and the BMD (b) and BV/TV (c) results (#a significant difference compared with β-TCP/CS, p < 0.05). d New bone formation and mineralization determined by fluorochrome-labelling analysis. Row 1 (yellow) shows tetracycline at week 2, row 2 (red) shows alizarin red at week 4, row 3 (green) shows calcein at week 6, and row 4 shows merged images of the three fluorochromes for the same group
