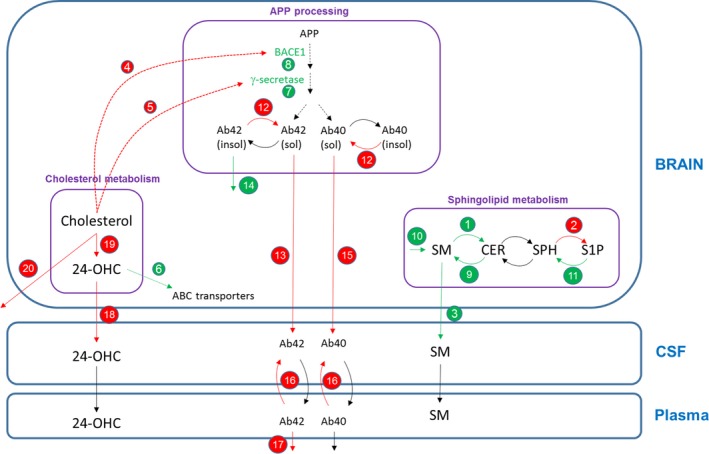
Figure 3.

Brain physiology model diagram showing the specific mechanisms and parameter values changing in the Alzheimer disease (AD) case compared to the healthy case. (†) Changes according to evidence found in literature; (‡) changes in amyloid precursor protein (APP) processing model to match published data (as described in the next section); (¥) changes in the cholesterol model to match 24‐OHC and cholesterol levels seen in in‐house preclinical data. Red arrows/text = parameter value decreases for AD case; green arrows/text = parameter value increases for AD case. Quantitative changes in the AD case: (1) production of ceramide (CER) from SM (†),8 (2) production of S1P from SPH (†),8 (3) transfer of SM from the brain to cerebrospinal fluid (CSF) (†),8 (4) half‐maximal effective concentration (EC)50 value for the effect of brain cholesterol on BACE1 (†),30 (5) EC 50 value for the effect of brain cholesterol on γ‐secretase (†),30 (6) effect of 24‐OHC on ABC transporters (†),31 (7) γ‐secretase expression (†),30 (8) BACE1 expression (†),30 (9) production of SM from CER (†), (10) synthesis of SM (†), (11) production of SPH from sphingosine‐1‐phosphate (S1P) (†), (12) reversible reaction from insoluble to soluble Aβ (‡), (13) transfer rate of amyloid beta (Aβ)42 from the brain to CSF (‡), (14) degradation of insoluble Aβ (‡), (15) transfer rate of Aβ40 from the brain to CSF (‡), (16) transfer rate of Aβ from plasma to CSF (‡), (17) degradation of Aβ42 in plasma (‡), (18) efflux of 24‐OHC (from the brain to CSF) (¥), (19) synthesis of 24‐OHC in brain (¥), and (20) degradation of brain cholesterol (¥). SPH, Sphingosine; SM, Sphingomyelin.
