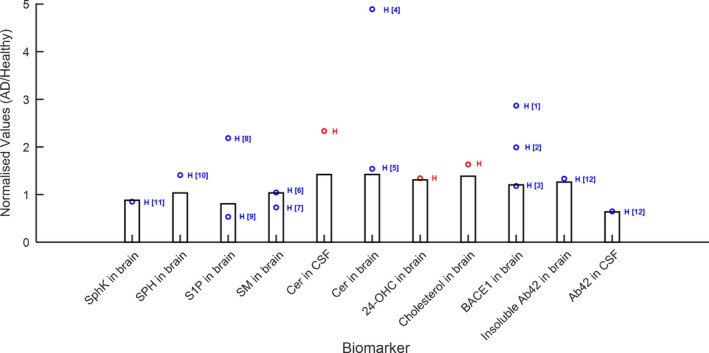
Figure 4.

Comparison of quantitative systems pharmacology model simulations (bars represent simulation results at age = 70 years) with data from literature and in‐house studies. (a) Comparison of baseline values in various biomarkers in patients with Alzheimer disease (AD): red points: Abbvie's data; blue points: literature data; H = human data; R = rat data; M = mouse data. References: [1] and [2] = Yang 2003,32 [3] = Xiong 2008,30 [4], [8] = de Wit 2017,33 [5], [6] = Couttas 2016,34 [7], [9], [10] = He 2010,35 [11] = Tagasugi 2011,36 [12] = Mattsson 2014.37 Cer, ceramide; CSF, cerebrospinal fluid; S1P, sphingosine‐1‐phosphate; SPH, Sphingosine.
