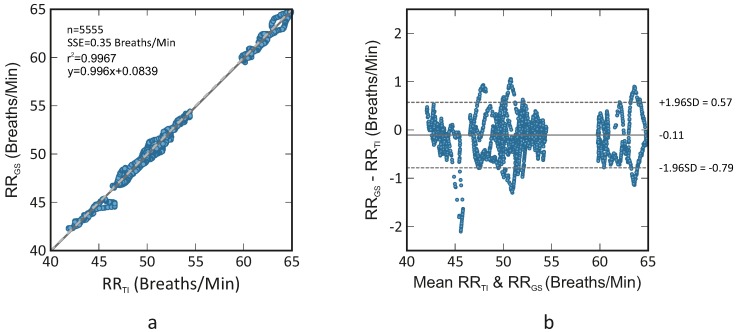
Figure 4.
Correlation plot (a) and Bland-Altman plot (b) comparing RR assessed using thermal imaging (RR) and RR assessed using ECG (RR); the plots comprise the data of all five rats. The former shows a R-squared of 0.967 and a sum of squared errors of 0.35 breaths/min. The latter demonstrates a bias of −0.11 breaths/min (solid line) and the 95 % limits of agreement vary between −0.79 breaths/min and 0.57 breaths/min (dashed lines).

