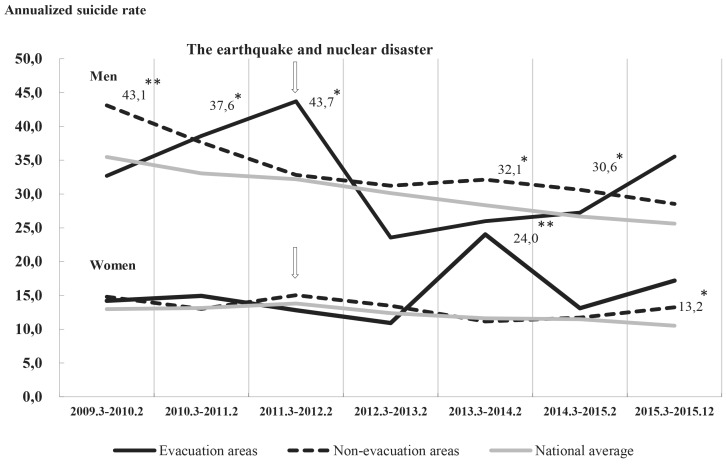
Figure 4A. Comparison of suicide rates in evacuation areas and non-evacuation areas with the national average.
Notes. Suicide rates (per 100,000 people) in evacuation areas and non-evacuation areas are shown by postdisaster period. The bold line and dotted line show the transition of suicide rates in evacuation areas and non-evacuation areas, respectively. The arrows indicate the occurrence of the nuclear disaster following the Great East Japan Earthquake. Postdisaster suicide rates were compared with the national average using Poisson distribution. * p < .05, ** p < .01, Poisson distribution test
Annualized suicide rate: Monthly suicide number/population × 100,000 × 12
Evacuation areas: Tamura, Minami-Soma, Kawamata, Hirono, Naraha, Tomioka, Kawauchi, Okuma, Futaba, Namie, Katsurao, and Iitate
Non-evacuation areas: Other municipalities in Fukushima Prefecture

