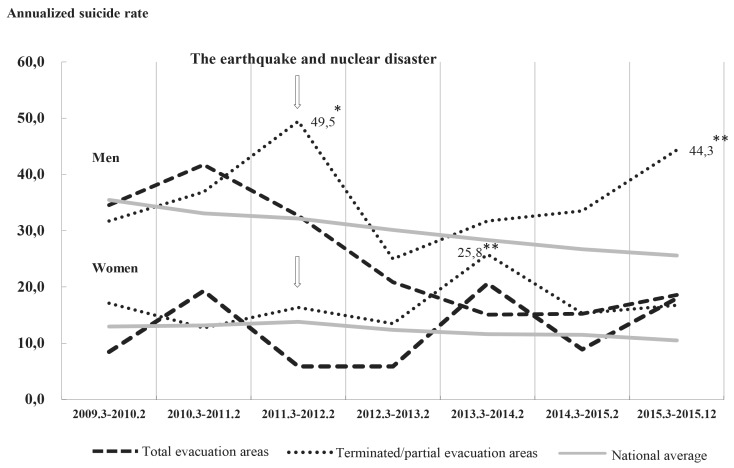
Figure 4B. Comparison of suicide rates in total evacuation areas and terminated/partial evacuation areas with the national average.
Notes. Suicide rates (per 100,000 people) in total evacuation areas and terminated/partial evacuation areas are shown by postdisaster period. The bold dotted line and thin dotted line show the transition of suicide rates in total evacuation areas and terminated/partial evacuation areas, respectively. The arrows indicate the occurrence of the nuclear disaster following the Great East Japan Earthquake. Postdisaster suicide rates were compared with the national average using Poisson distribution. * p < .05, ** p < .01, Poisson distribution test
Annualized suicide rate: Monthly suicide number/population × 100,000 × 12
Total evacuation areas: Naraha, Tomioka, Okuma, Futaba, Namie, Katsurao, and Iitate
Terminated/partial evacuation areas: Tamura, Minami-Soma, Kawamata, Hirono, and Kawauchi

