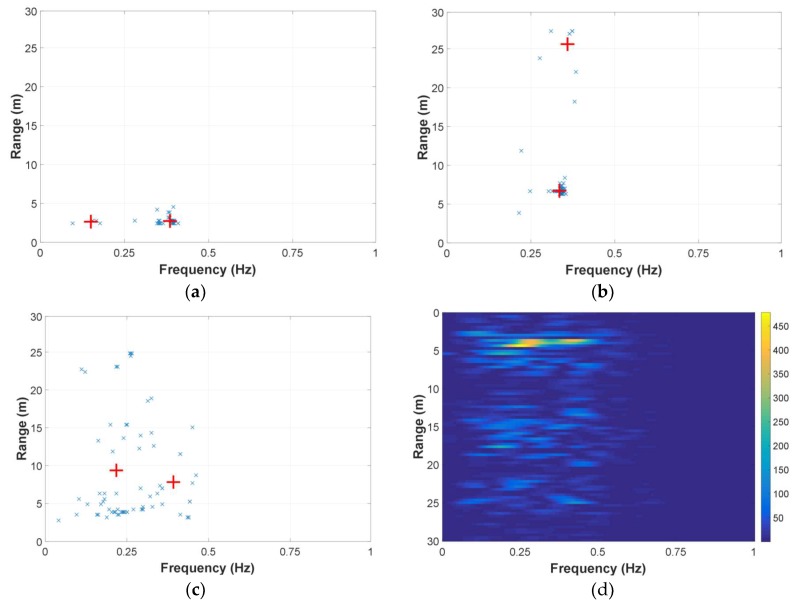
Figure 10.
(a) Power peaks of the sub-matrices and clustering result for the data measured with the human target being 3 m behind the wall; (b) Power peaks of the sub-matrices and clustering result for the data measured with the human target being 7 m behind the wall; (c) Power peaks of the sub-matrices and clustering result for the data without human target; and, (d) result matrix after the breath enhancement for the data without human target.

