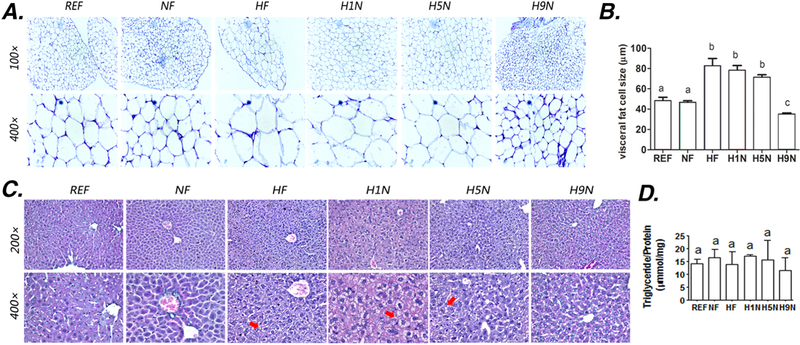
Figure 3. The H5N and H1N, but not the H9N diet, induced the adipocyte hypertrophy and the hepatocyte degeneration.

3A. HE staining of gonadal adipose tissue from the female offspring on 12-week postweaning HF diet
3B. Average size of the adipocyte was measured using Image J software as described in Methods section
3C. HE staining of liver samples from the female offspring on 12-week postweaning HF diet
3D. Amount of hepatic triglyceride content after 12-week exposure of postweaning HF diet. Hepatic Triglyceride content was measured using an adipogenesis detection kit (Abcam’s ab102513).
The results are presented as Mean ± SE, n= 3-7. Significance (p < 0.05) is presented by different characters comparing among groups in each tissue.
