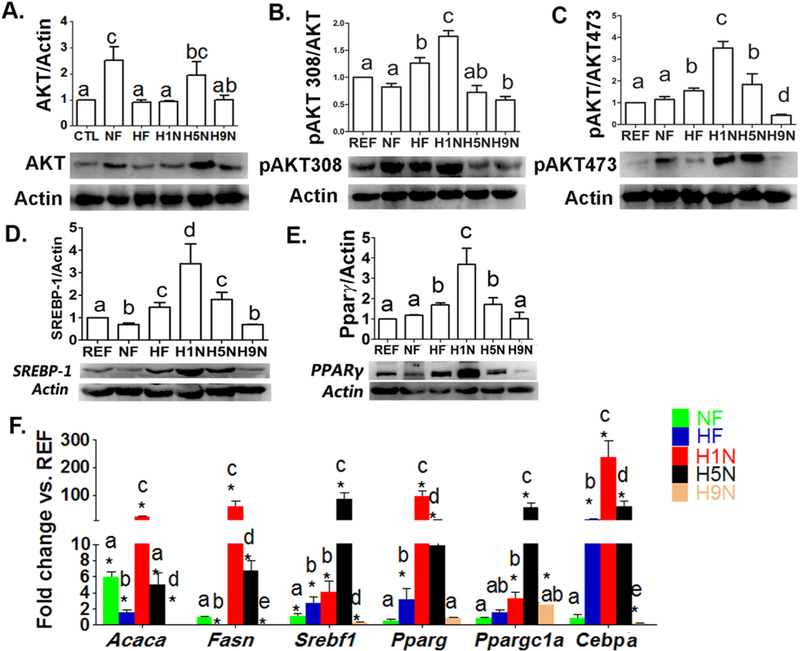
Figure 6. The H9N, but not the H5N and H1N diets, prevented the overactivation of the Akt signaling and lipogenesis in adipocytes.

6A-C. Adipocyte AKT (M) and phosphorylation of AKT at Thr308 (N) and Ser473 (O) were measured by Western Blots. Relative amounts of AKT and phosphorylation of AKT were calculated as the ratio of AKT/Actin, pAKT308/AKT and pAKT473/AKT.
6D. Adipocyte Srebpl expression was detected by Western blot analysis. Relative amounts of Srebpl were expressed as the ratio Srebpl/Actin.
6E. Adipocyte Ppar-γ expression was detected by Western blot analysis. Relative amounts of Ppar-y were expressed as the ratio Ppar-γ/Actin.
6F. Adipocyte expression of genes involved in lipogenesis and adipogenesis was measured by real-time PCR.
The results are presented as Mean ± SE, n= 3-7. Significance (p < 0.05) is presented by different characters comparing among groups in each tissue.
