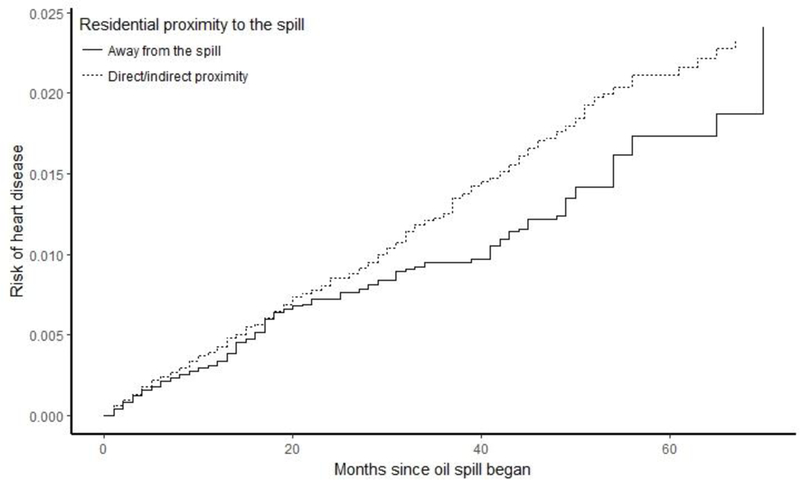
Figure 2.

Cumulative risk curves for residential proximity to the oil spill and self-reported MI/ fatal CHD, with inverse probability of exposure and censoring weights to account for gender, age, smoking, education, maximum total hydrocarbon exposure, and work duration.
