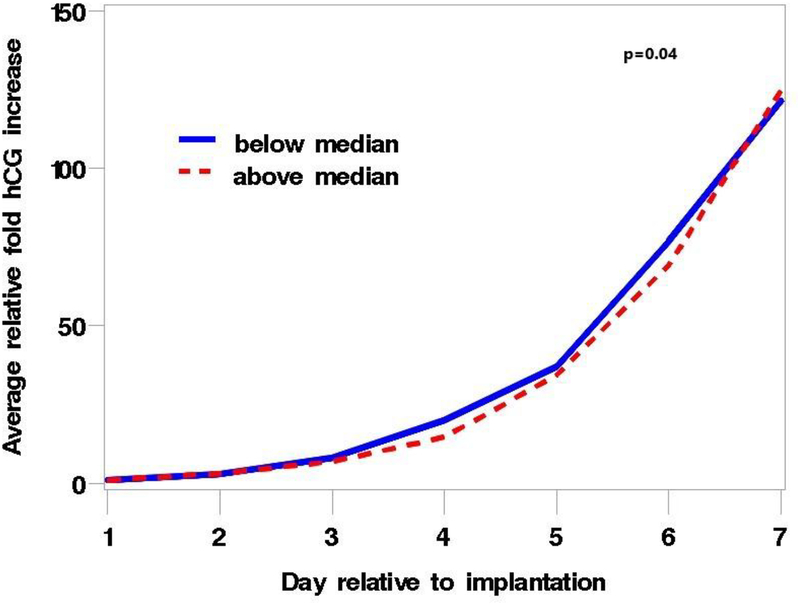
Figure 1.
Plot of the average relative fold increase in hCG over the 6 days after implantation, stratified by median conception cycle MBzP concentration, p = 0.04. The blue line represents values below the median and the red line values above the median. The average relative fold increase was calculated as the average of the ratio of the hCG concentrations on each of the days 2–7 to hCG concentrations on the day of implantation (day 1) for each woman. P value represents a 2 degree of freedom likelihood ratio test to assess the statistical significance of the influence of MBzP on the rate of rise.

