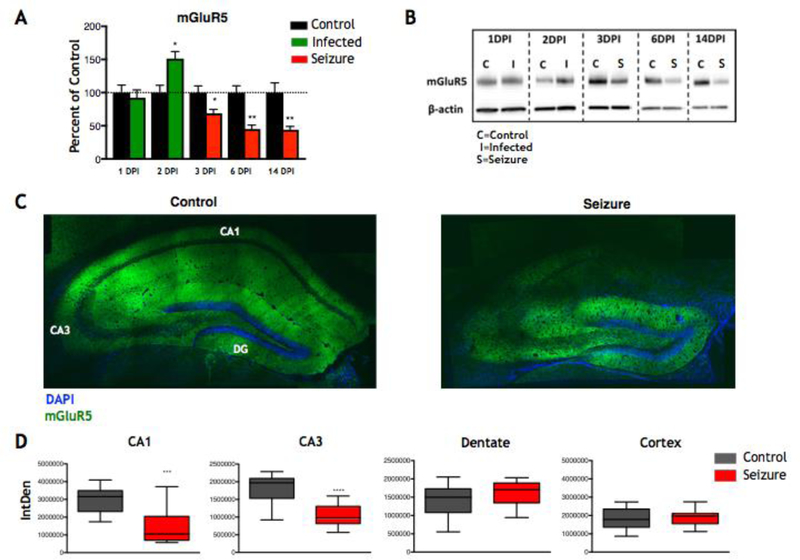
Figure 1.
mGluR5 expression during acute seizures. A) Quantification of western blots showing mGluR5 expression levels in TMEV-infected mice (1 and 2 DPI, green bars) and TMEV-infected mice experiencing seizures (3, 6, and 14 DPI, red bars) compared to mock-infected control mice (black bars) [*p≤0.05, **p≤0.01, Mann-Whitney U test; data presented as mean + standard error of the mean (SEM)]. B) Representative western blots of mGluR5 at each time point in (A) with β-actin used as a loading control. C) Representative 20× mosaic images of the hippocampus of control mice (left) and TMEV-infected mice experiencing seizures (right) at 6 DPI. CA1, CA3, and Dentate Gyrus (DG) regions are labeled in white in the left panel. D) Quantification of 40× images of the CA1, CA3, and Dentate regions of the hippocampus and the Cortex region of the brain from control mice (gray boxes) and TMEV-infected mice experiencing seizures (red boxes) at 6 DPI (***p≤0.001, ****p≤0.0001, Mann-Whitney U test).

