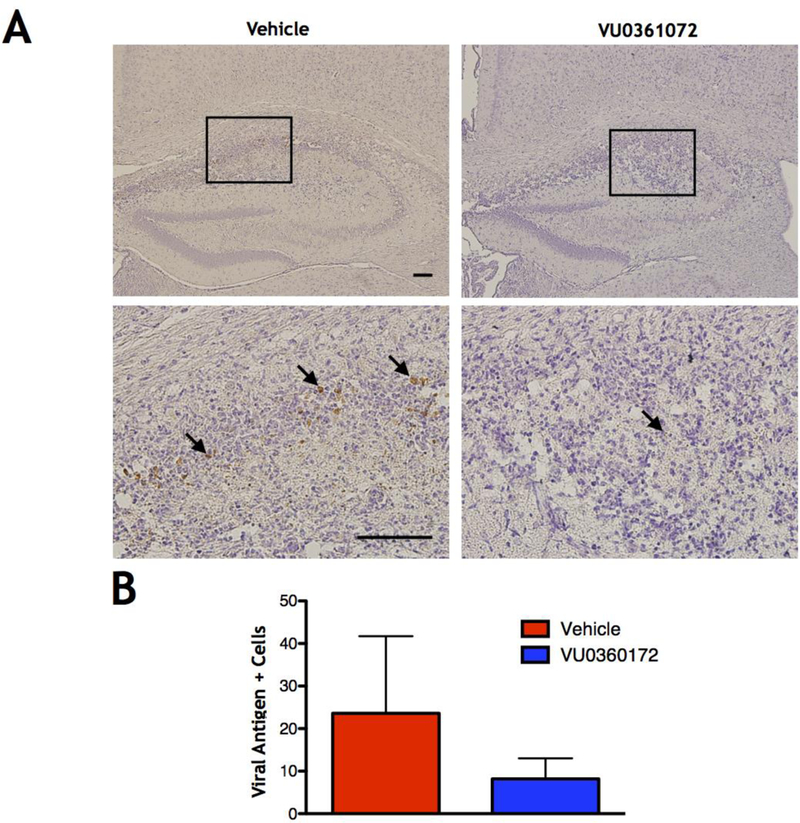
Figure 7.
TMEV antigen clearance at 14 DPI. (A) Representative images of TMEV antigen staining (arrows) at 14 DPI in the hippocampus of Vehicle-treated animals (left panels), at 10× (top left) and 40× (bottom left) magnification, and VU0360172-treated animals (right panels) at 10× (top right) and 40× (bottom right) magnification (scale bars=100 μm). (B) Quantification of TMEV antigen staining throughout the brain in Vehicle- versus VU0360172-treated mice. An outlier in the Vehicle-treated group was detected using the Grubb’s test (p<0.05). However, the presence or absence of this data point did not affect the significance of the results and therefore it was not removed from the final data set.

