Figure 7.

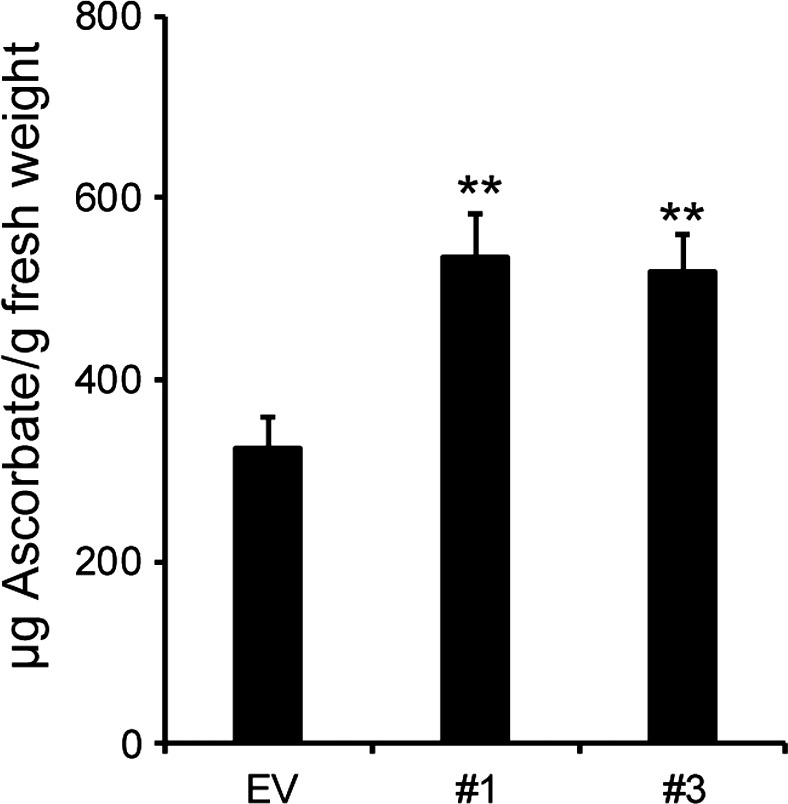
Ascorbic acid content of hpGGLT1 leaves. Data are the mean of eight to nine plants ± SEM. Asterisks indicate a significant different from EV (Student's t‐test, *P < 0.05, **P < 0.01, ***P < 0.001).

Ascorbic acid content of hpGGLT1 leaves. Data are the mean of eight to nine plants ± SEM. Asterisks indicate a significant different from EV (Student's t‐test, *P < 0.05, **P < 0.01, ***P < 0.001).