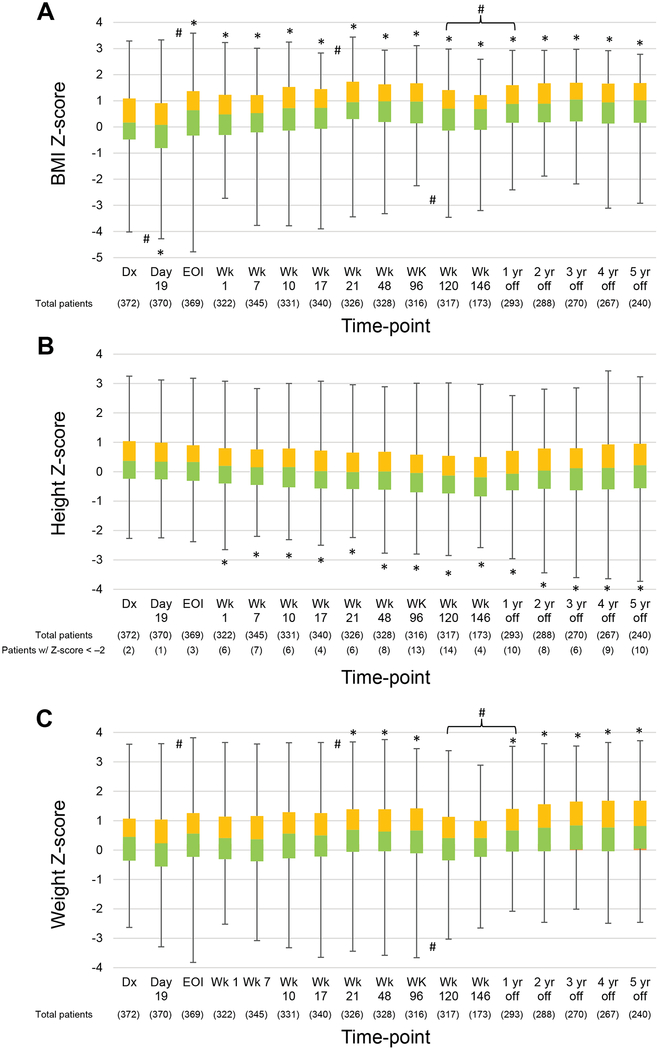
Figure 3.
Longitudinal changes in the median body mass index (BMI) (A), height (B), and weight (C) Z-scores of patients during therapy and in the off-therapy period.
Boxes show scores from the first quartile to the third quartile. The border between the 2 boxes shows the median Z-score. Error bars show minimum and maximum values. Significant differences from baseline values and intervals with significant changes in Z-scores are indicated by the symbols * and #, respectively. As only males received week 146 therapy, interval changes between week 120 and 1 year off therapy are evaluated. Symbols above the line represent increases in Z-scores; those below the line show decreases between 2 time-points. Abbreviations: BMI, body mass index; Dx, diagnosis; EOI, end of induction; Wk, week.

